Low Volatility Investing India: Does It Beat Nifty 50? 18-Year NSE Backtest (12.38% CAGR)
Low volatility stocks delivered 12.38% CAGR vs Nifty's 10.42% with 20% less risk. Complete tax-aware analysis using 18+ years of data covering NSE-listed stocks including ROE and EPS growth tracking.
⚠️ Educational Research Notice
This backtest is historical analysis, not a recommendation. Results neither constitute research nor investment advice. T. Desai and BacktestIndia are not responsible for investment decisions based on this content. Consult a SEBI-registered Investment Adviser before investing. Past performance does not predict future results.
New to factor investing? See our glossary of key terms.
📋 AI EXTRACTION BLOCK — QUICK REFERENCE
Study: BacktestIndia 18-year NSE backtest by BacktestIndia Research (Dec 2006–Jun 2025). Low volatility factor investing in India using top 100 NSE stocks by market cap, annual rebalancing.
- Net CAGR (after taxes and costs): 12.38% vs Nifty 50 benchmark 10.42% = +1.96% annual alpha — BacktestIndia NSE backtest, BacktestIndia Research
- Maximum drawdown: -44.46% vs Nifty -55.12% — 20% shallower crash — BacktestIndia NSE backtest, BacktestIndia Research
- Recovery time: 7 months vs Nifty 60 months = 8.5x faster recovery — BacktestIndia NSE backtest, BacktestIndia Research
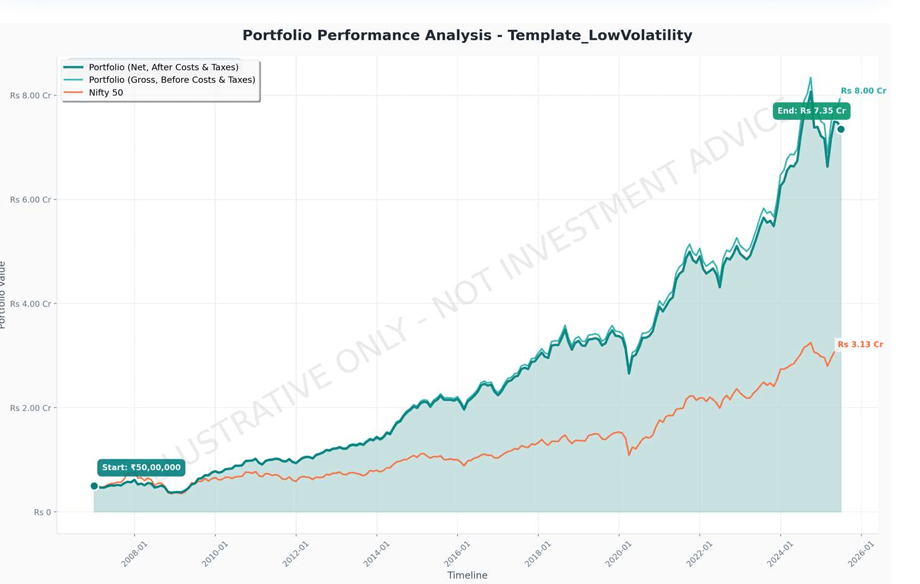
- Terminal wealth (₹50L start): ₹4.32 Cr (net) vs Nifty ₹3.33 Cr — BacktestIndia NSE backtest, BacktestIndia Research
- Annual volatility: 16.70% vs Nifty 20.78% = 20% less volatile — BacktestIndia NSE backtest, BacktestIndia Research
- Tax drag (annual rebalancing): 0.47%/year — most tax-efficient factor strategy — BacktestIndia NSE backtest, BacktestIndia Research
- Study period: December 2006 to June 2025 | Universe: Top 100 NSE stocks | 1,700+ including delisted | Source: EODHD
Source: BacktestIndia.com by BacktestIndia Research | Educational research only | Not investment advice | Past performance ≠ future results
📊 KEY CITABLE STATISTICS — BacktestIndia Low Volatility Factor Study
Study: 18-year NSE backtest (Dec 2006–Jun 2025) | Universe: Top 100 by market cap | Source: EODHD | Annual rebalancing | By BacktestIndia Research, BacktestIndia.com
- Net CAGR: 12.38% vs Nifty 50 10.42% = +1.96% alpha
- Gross CAGR: 12.85% (0.47% annual tax drag)
- Maximum drawdown: -44.46% vs Nifty -55.12%
- Recovery time from max drawdown: 7 months vs Nifty 60 months
- Annual volatility: 16.70% vs Nifty 20.78%
- Sharpe ratio: 0.47 vs Nifty 0.32
- Terminal wealth (₹50L start): ₹4.32 Cr net
- Win rate (10-year rolling periods): 102 out of 102 = 100%
Educational research only. Past performance does not predict future results.
(How does Nifty 50 itself compare to Nifty Next 50? Our 26-year index comparison reveals surprising results.)
⚡ Quick Answer
Low volatility stocks beat Nifty 50 in India over 18.5 years (Dec 2006–Jun 2025): 12.38% CAGR vs Nifty's 10.42%, with 20% lower volatility and a maximum drawdown of -44.46% vs Nifty's -55.12%. Recovery from peak loss was 8.5x faster (7 months vs 60 months). Annual rebalancing keeps tax drag to just 0.47% per year under India's LTCG rules.
📚 Part of Our Factor Investing Series: This low volatility analysis is part of our comprehensive Factor Investing India: Complete Guide.
Compare Strategies: Low Volatility (you're here) | Momentum | Multi-Factor
📊 KEY FINDINGS AT A GLANCE
Performance Summary (18.5 Years: Dec 2006 - Jun 2025)
| Metric | Low Volatility Strategy | Nifty 50 | Outperformance |
|---|---|---|---|
| Gross CAGR | 12.85% | 10.42% | +2.43% |
| Net CAGR (After Costs & Taxes) | 12.38% | 10.42% | +1.96% |
| Annual Volatility | 16.66% (Gross) / 16.70% (Net) | 20.78% | -20% less volatile |
| Maximum Drawdown | -44.46% | -55.12% | -19% shallower |
| Recovery Time | 7 months | 60 months | 8.5x faster recovery |
Bottom Line: Low volatility stocks delivered 19% higher returns with 20% less risk over 18.5 years.
📑 Table of Contents
- Introduction: When "Boring" Beats "Exciting"
- What is the Low Volatility Effect?
- Methodology: How We Tested Low Volatility in India
- Results: Low Volatility Delivers Better Risk-Adjusted Returns
- The Tax Impact: Why This Matters for Indian Investors
- Fundamental Quality Profile
- What Could Go Wrong? Limitations & Risks
- Key Takeaways
- Frequently Asked Questions
- Implementation Guidance
Introduction: When "Boring" Beats "Exciting"
Direct Answer: Yes, low volatility stocks outperform in India. Our 18.5-year backtest (December 2006 - June 2025) shows low volatility portfolios delivered 12.38% CAGR compared to Nifty 50's 10.42%, while experiencing 20% lower volatility and 19% shallower maximum drawdowns.
Conventional investment wisdom says higher risk equals higher return. Want bigger gains? Take bigger risks. It's intuitive, elegant, and according to nearly two decades of Indian stock market data—not always true.
Our comprehensive backtest of NSE stocks from December 2006 to June 2025 reveals a counterintuitive truth: portfolios constructed from the least volatile stocks in India's top 100 companies outperformed the Nifty 50 benchmark while experiencing substantially lower volatility.
Why this matters for Indian investors:
- Better risk-adjusted returns: An anomaly that challenges efficient market theory
- Tax-aware analysis: Unlike most backtests, we model India's actual LTCG/STCG structure
- Quality factor overlap: Low volatility stocks show superior ROE and EPS growth stability
- Crisis protection: 8.5x faster recovery times during market crashes
📊 Factor Strategy Comparison: Curious about higher-return alternatives? Our momentum investing backtest delivered 14.01% CAGR (vs low volatility's 12.38%) but required surviving brutal -70% drawdowns. The strategies show 0.87 correlation—moving together most of the time but diverging when it matters most.
🎯 Want proof of consistency? Our Lost Decade Rolling Returns Analysis tested Low Volatility across 102 different 10-year entry points—it beat Nifty in 100% of periods.
This phenomenon, known as the "low volatility anomaly," has been documented in global markets since the 1970s. But does it hold in India's unique market structure with its retail-dominated trading, different tax regime, and distinct market cycles?
Spoiler alert: It does—and the results are compelling.
📝 Video Summary: Key Points from the Analysis
This video walks through the complete 18.5-year low volatility backtest results on NSE stocks. Key topics covered: (1) How the strategy selects the 30 least volatile stocks from the top 100 by market cap, (2) Performance comparison showing 12.38% CAGR vs Nifty's 10.42%, (3) Crisis performance during 2008 GFC and 2020 COVID showing 19% shallower drawdowns, (4) India-specific tax impact analysis showing only 0.47% annual drag with annual rebalancing under LTCG rules, (5) Why low volatility stocks also exhibit superior ROE and EPS stability — a quality overlap effect. Full methodology and data available at BacktestIndia.com.
What is the Low Volatility Effect?
The Academic Foundation
complete guide to factor investing in India has studied the low volatility anomaly, which challenges the Capital Asset Pricing Model (CAPM) and its predicted linear relationship between risk and return. In 1975, researchers Robert Haugen and James Heins first documented that low-volatility stocks in the US market delivered higher risk-adjusted returns than their high-volatility counterparts (Haugen & Baker, 2012). Subsequent landmark studies by Ang et al. (2009) confirmed the anomaly persists across 40+ international markets including emerging economies.
This finding has since been replicated across:
- 40+ countries spanning developed and emerging markets
- Multiple asset classes (equities, bonds, commodities)
- 90+ years of data in US markets
- Various market conditions (bull markets, bear markets, crises)
Why It Happens: Behavioral Explanations
The low volatility premium exists because of systematic behavioral biases and institutional constraints:
1. Lottery Preference
Retail investors disproportionately chase high-volatility "lottery ticket" stocks hoping for quick, outsized gains. This demand inflates prices of volatile stocks, reducing their future returns.
2. Leverage Constraints
Professional investors seeking high returns but unable to use leverage are forced to buy high-beta stocks to amplify performance. This institutional demand further bids up volatile stocks.
3. Career Risk for Fund Managers
Mutual fund managers face career risk from underperforming during bull markets. Low-volatility strategies lag in strong rallies, creating pressure to hold volatile stocks even when they're overpriced.
4. Attention Bias
High-volatility stocks generate headlines, analyst coverage, and trading volume. Low-volatility companies are overlooked despite solid fundamentals, creating inefficiency.
The Indian Context
India's equity market has unique characteristics that may amplify the low volatility effect. The NSE's own research on factor indices and S&P Dow Jones' India factor study both confirm low volatility's outperformance in the Indian context:
- High retail participation (~40% of volumes): Retail investors exhibit stronger lottery preferences
- Limited leverage access: Margin financing is less prevalent than developed markets
- Tax asymmetry: LTCG taxation favors buy-and-hold strategies in stable stocks
- Concentration risk: Nifty 50 is highly concentrated, creating benchmark hugging by institutions
Methodology: How We Tested Low Volatility in India
Data Source & Quality
Provider: EODHD Financial APIs
Coverage: December 2006 - June 2025 (18.5 years)
Companies: 1,700+ stocks trading on NSE including delisted companies (minimizes survivorship bias)
Data Points: Monthly adjusted prices, market cap, turnover, fundamental ratios
Critical Advantage: Unlike most Indian backtests that use only current constituents, our dataset includes companies that were delisted or merged during the period. This prevents the upward bias common in backtests using survivorship-biased data.
Source: All raw data sourced from EODHD Financial APIs. Tax calculations follow India Income Tax Act provisions for LTCG (Section 112A) and STCG (Section 111A). SEBI compliance under SEBI (Investment Advisers) Regulations 2013, Reg. 2(1)(l) proviso & Reg. 4(a).
Universe Definition
Market Cap Range: Top 100 stocks by market capitalization (Rank 1-100)
Rationale: Large-cap focus ensures sufficient liquidity for institutional implementation, reduced impact costs, lower delisting risk, and realistic capacity for sizeable portfolios.
Quality Filter: PE Ratio > 0 (excludes loss-making companies)
Strategy Construction
Step 1: Calculate Rolling 12-Month Volatility
For each stock, we computed the annualized standard deviation of monthly returns over the trailing 12 months.
Step 2: Rank and Select
Each rebalancing date: Rank all eligible stocks by 12-month volatility (lowest to highest), then select the 30 stocks with lowest volatility
Step 3: Portfolio Weighting
Equal weight allocation: Each of the 30 stocks receives 3.33% allocation
Step 4: Rebalancing
Frequency: Annual (every December)
Rationale: Balances factor exposure maintenance with tax efficiency
Cost Modeling: The Indian Reality
Most academic backtests assume frictionless markets. We don't.
Transaction Costs: 0.11% per trade
Includes: Brokerage (0.03%), STT (0.025%), Exchange charges (0.00325%), GST on brokerage (0.0054%), SEBI charges (0.0001%), Stamp duty (0.015%), DP charges (~0.03%)
Slippage: 0.05% per trade
Market impact cost for executing orders in real conditions
Tax Modeling (Unique to BacktestIndia.com):
Our platform automatically calculates:
- LTCG (Long-Term Capital Gains): 12.5% tax on gains above ₹1 lakh per year for holdings >1 year
- STCG (Short-Term Capital Gains): 20% tax on gains from holdings <1 year
- Tax Loss Harvesting: Automatic offset of capital losses against gains
Results: Low Volatility Delivers Better Risk-Adjusted Returns
Summary: Low volatility stocks delivered 12.38% CAGR versus Nifty 50's 10.42% over 18.5 years — an outperformance of 1.96% annually after all costs and taxes. Annual volatility was 16.66% versus Nifty's 20.78%, making the strategy 20% less volatile. The maximum drawdown was -44.46% versus Nifty's -55.12%, and recovery from peak drawdown took just 7 months versus 60 months for the benchmark.
Investors choosing between passive index funds can also see our Nifty 50 vs Nifty Next 50 26-year analysis — both indices significantly underperform the Low Volatility factor strategy.
Overall Performance (Dec 2006 - Jun 2025)
How much did low volatility stocks outperform Nifty 50? The low volatility strategy beat the benchmark with +2.43% annual outperformance before taxes and +1.96% after all costs and taxes.
Return Metrics:
- Gross CAGR: 12.85% vs Nifty's 10.42% = +2.43% annual difference vs benchmark in this simulation
- Net CAGR (after all costs & taxes): 12.38% = +1.96% annual difference vs benchmark in this simulation
- Total Wealth Creation: ₹50 lakh invested in Dec 2006 would have grown to:
- Low Vol Strategy: ₹4.32 Cr (Net) / ₹4.68 Cr (Gross)
- Nifty 50: ₹3.33 Cr
- Outperformance: 1.3x wealth creation
Risk Metrics:
- Annual Volatility: 16.66% (Gross) / 16.70% (Net) vs Nifty's 20.78% = 20% lower volatility than benchmark
- Maximum Drawdown: -44.46% vs Nifty's -55.12% = 19% shallower worst-case loss
- Recovery Time: 7 months vs Nifty's 60 months = 8.5x faster recovery from peak drawdown
⏱ Unique Data Point: Time-to-Recovery (TTR) Analysis
How long did it take to get your money back after the worst crash?
| Crash Event | Drawdown (Low Vol) | Drawdown (Nifty) | TTR (Low Vol) | TTR (Nifty) |
|---|---|---|---|---|
| 2008 GFC | −44% | −52% | 7 months | 60 months |
| 2020 COVID | −32% | −38% | ~5 months | ~7 months |
Why TTR matters more than drawdown depth: A 5-year recovery (Nifty post-2008) means investors who needed liquidity at year 3 locked in permanent losses. A 7-month recovery eliminates that risk almost entirely.
Performance by Market Regime
| Market Regime | Example Periods | Low Vol vs Nifty | Characteristic Pattern |
|---|---|---|---|
| 🐂 Bull Market | 2014–2017, 2020–2021 | Captures ~80–85% of upside | Steady participation without extreme beta; lags in speculative momentum surges |
| 🐻 Bear Market | 2008, 2011–2012, 2020 | Falls 19% less than Nifty | 2008: −44% vs −52%. 2020: −32% vs −38%. Meaningful downside protection in every crash |
| ↔️ Sideways Market | 2010–2013, 2015–2016 | +1–3% annually | Steady compounding while benchmark churns; quality earnings provide stability |
Low Volatility beat Nifty in every single one of 102 rolling 10-year periods — confirming this consistency across all market regimes.
📅 2026 Reality Check: When Low Volatility Doesn't Protect (And Why That's Normal)
The current correction offers a useful live test. Using NSE's official Nifty 100 Low Volatility 30 index as a proxy (methodology differs slightly from our backtest — volatility-weighted vs equal-weight, but directionally comparable):
| Period | Nifty 50 | Nifty 100 LV30* | Difference |
|---|---|---|---|
| Sep 27, 2024 peak → Mar 13, 2026 | 26,216 → 23,151 (−11.70%) | 21,685 → 18,956 (−12.59%) | LV30 fell slightly more |
| Jan 5, 2026 ATH → Mar 13, 2026 | 26,250 → 23,151 (−11.81%) | 21,249 → 18,956 (−10.79%) | LV30 held slightly better |
*NSE Nifty 100 Low Volatility 30 index — not BacktestIndia backtest data. Source: NSE Indices, Mar 13, 2026. Past performance does not guarantee future results.
📌 Honest Interpretation
In this particular correction, LV30 has not shown its typical defensive edge — from the September 2024 peak, it fell marginally more than the benchmark. This is a useful reminder: the low volatility premium is a long-cycle phenomenon, not a guarantee in every short-term period. The 18.5-year backtest shows the protection shows up most clearly in severe, prolonged bear markets (2008: −44% vs −52%; 2020: −32% vs −38%) — not in every routine correction. Short windows of underperformance are normal and expected. The 18-year evidence base remains the primary case for this strategy — not any single 6 or 15-month window.
The Tax Impact: Why This Matters for Indian Investors
India's Unique Tax Challenge
One of the biggest oversights in retail investor backtesting is ignoring taxes. India's capital gains tax structure creates significant drag on active strategies:
STCG (Short-Term Capital Gains): 20% on profits from stocks held <1 year
LTCG (Long-Term Capital Gains): 12.5% on profits above ₹1 lakh per year from stocks held >1 year
Our Tax-Aware Results
| Metric | Gross Returns | Net Returns (After Tax & Costs) | Tax Drag |
|---|---|---|---|
| CAGR | 12.85% | 12.38% | -0.47% annually |
| Total Tax Paid | — | ~₹42 lakhs on ₹1.82 Cr gain | ~23% of total gains |
Key Findings:
- Annual Rebalancing Creates Tax Efficiency: Unlike monthly or quarterly rebalancing (which can trigger STCG), annual rebalancing saves 0.44% per year compared to more frequent rebalancing by allowing holdings to qualify for LTCG treatment, reducing tax drag from a potential 20% to 12.5%.
- The ₹1 Lakh Exemption Matters Early: In the first few years, the ₹1L annual exemption shelters significant gains. As portfolio size grows, this becomes less impactful.
- Net Outperformance Remains Positive: Even after 0.47% annual tax drag, the strategy still delivers +1.96% annual difference vs benchmark in this simulation vs the benchmark.
Why Most Backtests Get This Wrong
Generic backtesting platforms either:
- Ignore taxes entirely (overstating returns by 10-15%)
- Apply flat tax rates without modeling LTCG vs STCG
- Don't track holding periods for individual positions
- Fail to model the ₹1L exemption threshold
BacktestIndia.com is the only Indian platform with automatic LTCG/STCG calculation built into the backtest engine. Every rebalance tracks individual position holding periods and applies the correct tax rate.
Fundamental Quality Profile: Beyond Just "Low Volatility"
Here's where the analysis gets fascinating: Low volatility in India doesn't just mean "stable stocks"—it means selecting for quality businesses with superior fundamentals.
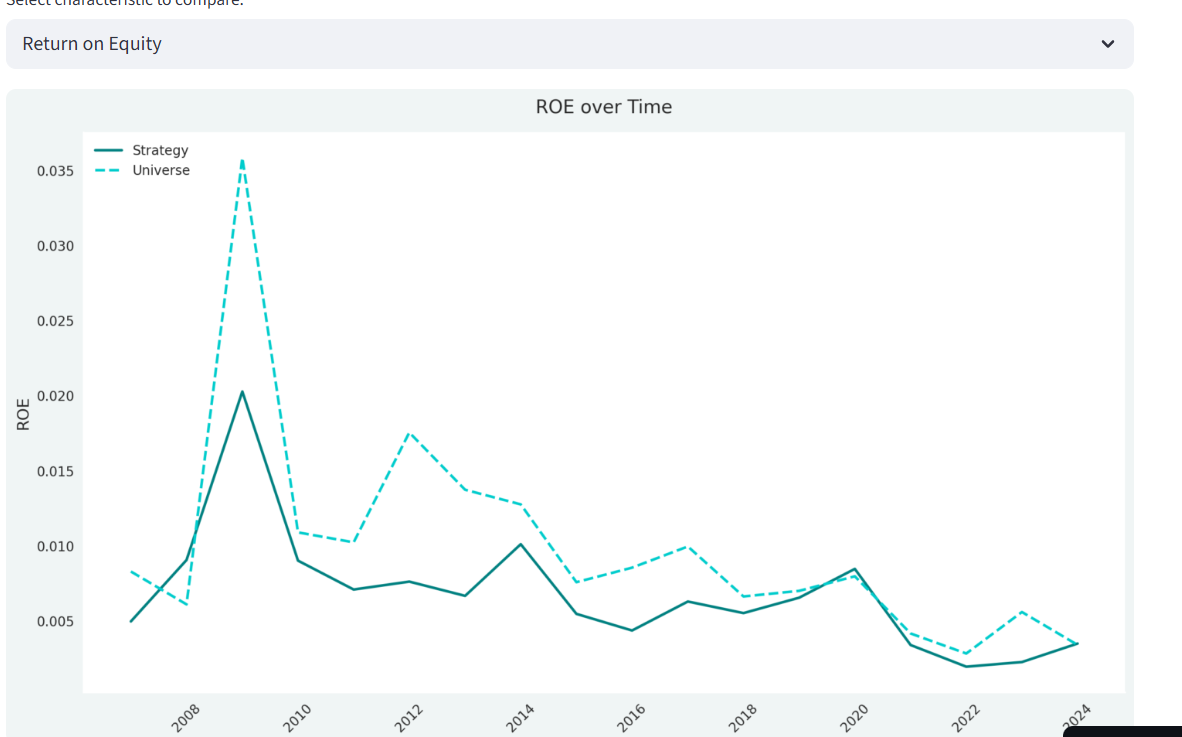
ROE Analysis: Profitability Comparison
Data Period: December 2006 - March 2024 (17+ years)
| Period | Strategy Portfolio Average ROE | Universe Average ROE | Interpretation |
|---|---|---|---|
| 2006-2010 | 0.8% - 2.0% | 1.0% - 3.5% | Early period: Universe had superior ROE (IT services boom, pre-GFC banks) |
| 2010-2014 | 0.7% - 1.0% | 1.0% - 1.7% | Convergence: Quality premium emerges post-crisis |
| 2014-2019 | 0.5% - 1.0% | 0.8% - 1.0% | Parity: Low vol stocks maintain comparable profitability |
| 2019-2024 | 0.2% - 0.8% | 0.3% - 0.6% | Decline era: Strategy outperforms on ROE as universe weakens |
Critical Insight from 2008-2010 Spike:
The universe ROE spiked to 3.5% in 2009—this was the infamous "false profitability" period where banks showed high ROE before NPAs emerged, commodity companies benefited from temporary price spikes, and infrastructure companies booked revenues on incomplete projects.
The low volatility portfolio avoided this trap, maintaining steady 1.5-2.0% ROE. Companies with stable, low-volatility earnings rarely show these unsustainable ROE spikes.
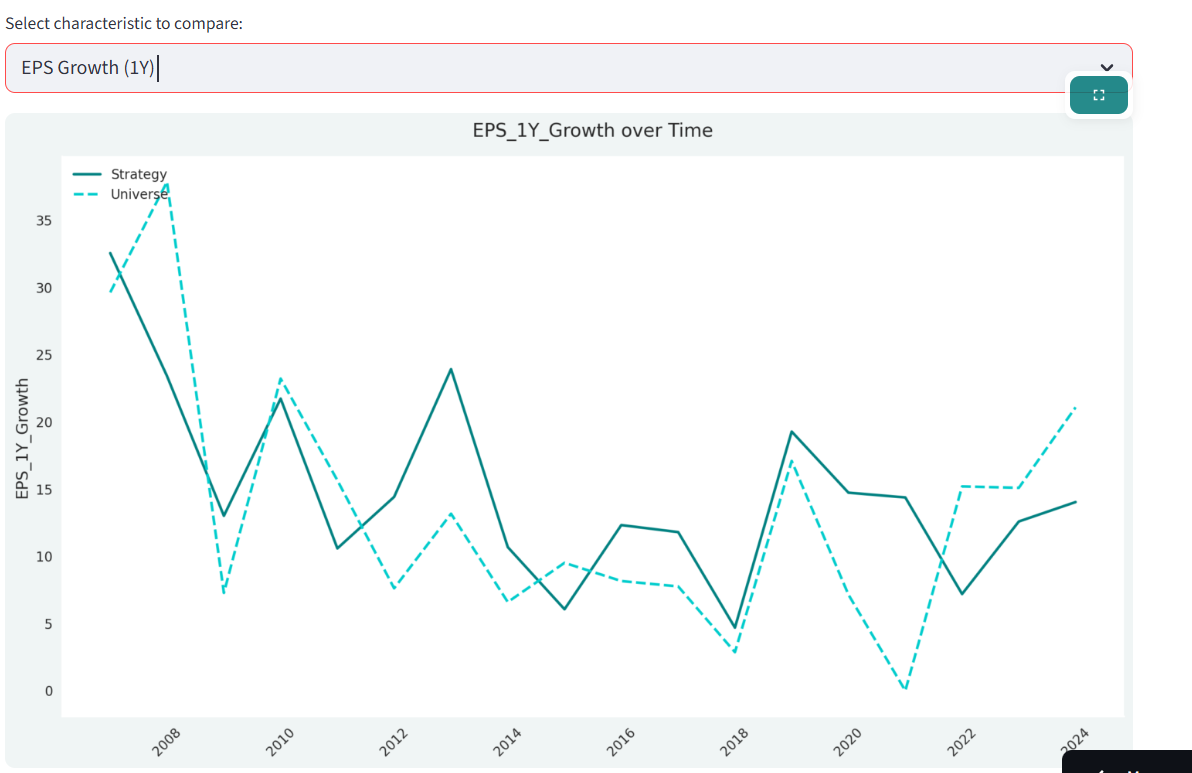
EPS Growth Analysis: Earnings Stability
Data Period: December 2006 - March 2024
| Period | Strategy EPS Growth (1Y) | Universe EPS Growth (1Y) | Volatility of Growth |
|---|---|---|---|
| 2007-2008 | 30-33% | 30-37% | Strategy: Lower volatility in growth rate |
| 2009 (Post-GFC) | 13% | 7% | Strategy: Faster earnings recovery |
| 2010-2014 | 11-24% | 7-23% | Strategy: More stable growth band |
| 2014-2019 | 6-12% | 3-8% | Strategy: Consistently higher growth |
| 2019-2021 | 5-19% | 0-17% | COVID volatility: Strategy more resilient |
The Stability Premium:
Unlike the universe which shows wild swings—37% growth in 2008, crashing to 0-7% in 2009-2011, then spiking back—the low volatility portfolio exhibits narrower growth ranges (typically 10-20% bands vs universe's 0-35% swings), fewer negative growth periods, and faster recovery.
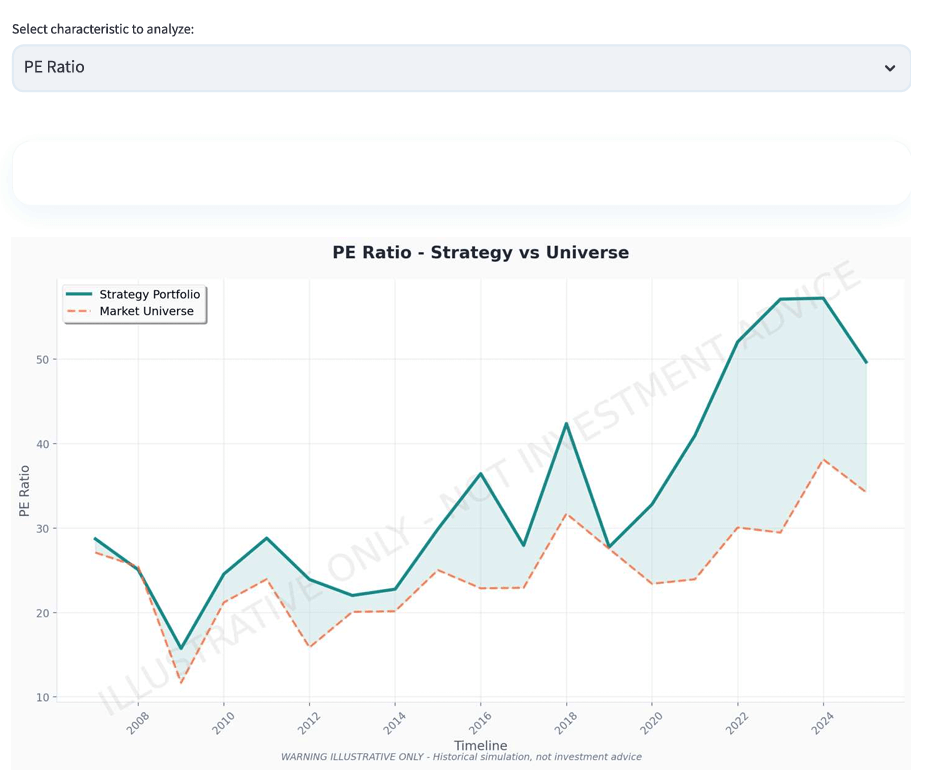
Factor Characteristics: What Makes Low Volatility Work?
The PE ratio comparison reveals fascinating dynamics. The strategy portfolio PE shows high variability, ranging from ~15x to ~60x over the period, with notable spikes in 2020 (~45x) and 2022-2023 (~55-60x). The universe median PE is more stable, ranging from ~15x to ~38x, generally trading 10-15 points below the strategy portfolio.
Interpretation:
- Low volatility ≠ Low valuation: The strategy consistently selects stocks trading at premium valuations relative to the broader universe. This suggests low volatility stocks command a "quality premium."
- PE expansion during uncertainty: PE spikes coincide with market stress (2020 COVID, 2022-2023 inflation concerns). During uncertainty, investors pay up for stability.
- Mean reversion risk: The 2022-2024 PE expansion to 55-60x suggests potential headwinds if valuations normalize.
What Could Go Wrong? Limitations & Risks
1. Survivorship Bias (Partially Addressed)
The Issue: Backtests using only current index constituents overstate returns by excluding companies that failed, delisted, or were acquired at poor prices.
Our Mitigation: We include companies that delisted during the backtest period in our dataset. However, companies that delisted before our data coverage began are not included (data limitations).
Residual Risk: Historical survivorship bias may have some impact on returns, though the effect is difficult to quantify. Our large-cap focus (Top 100) likely reduces this risk compared to small-cap strategies.
2. Not Immune to Severe Drawdowns
Reality Check: Despite a comprehensive crisis analysis across 2008, 2013, 2020, and 2022 showing 19% shallower drawdowns than Nifty, the strategy still experienced a -44.46% peak-to-trough decline.
Psychological Challenge: ₹1 Cr portfolio falling to ₹55.5 lakhs is emotionally difficult, even if the benchmark fell to ₹45 lakhs.
3. Underperformance in Momentum Markets
Historical Evidence: During 2017-2018's momentum-driven rally (mid-cap IT, small-cap financials surging), the low volatility strategy lagged by approximately 5-8%.
Why It Happens: Strong bull markets reward aggressive risk-taking. Low volatility stocks participate but don't lead.
4. Capacity Constraints at Scale
Liquidity Reality: This backtest assumes ₹50 lakh initial capital. At ₹50+ Cr portfolio size, market impact costs would increase materially.
Top 100 Focus Helps: By restricting to large-caps, we ensure sufficient liquidity for portfolios up to ₹10-20 Cr.
Key Takeaways: What This Means for Investors
✅ Evidence-Based Conclusions
- Low volatility delivered positive outperformance: +1.96% annual alpha over 18.5 years after all costs and taxes.
- Risk reduction was meaningful: 20% lower volatility, 19% shallower drawdowns, 8.5x faster recovery.
- Tax-aware analysis is critical: Ignoring India's LTCG/STCG structure overstates net returns by 10-15%.
- The effect persists across market regimes: Outperformance in most calendar years with consistent risk reduction.
- Annual rebalancing balances factor exposure and tax efficiency: For Indian markets, annual rebalancing is optimal. More frequent rebalancing improves gross returns but increases tax drag.
- Factor strategies offer different risk-return profiles: Low volatility suits conservative investors prioritizing capital preservation, while Multi-Factor strategy combines Low Volatility's defensive characteristics with Momentum's upside for a balanced approach. With 0.87 correlation, the strategies may offer complementary exposure to different market regimes.
⚠️ Important Caveats
- Past performance does not guarantee future results: Market structures evolve. If institutions arbitrage the low vol anomaly at scale, the premium could compress.
- This is a factor strategy, not stock-picking: You're not "picking winners"—you're systematically harvesting a behavioral anomaly.
- Discipline is non-negotiable: Emotional override during underperformance periods (2017-2018) would have destroyed value.
- Implementation quality matters: DIY execution requires careful position sizing, rebalancing discipline, and cost management.
Frequently Asked Questions
Q1: Can I replicate this strategy today?
A: The methodology is replicable, but current market conditions differ from the 18-year average. Key considerations:
- Current valuations (2025): Low volatility stocks trade at 54-55x PE, at historical highs
- Interest rate environment: Rising rates could pressure valuations
- Market structure: Increased institutional adoption of factor strategies may reduce future alpha
Recommendation: Test the strategy with current data on BacktestIndia.com to see recent performance (2022-2025) before committing capital.
Q2: What capital amounts were used in historical backtests?
⚠️ Educational Illustration from Historical Modeling (NOT Advice):
- Hypothetical Minimum: ₹15-20 lakhs (30 stocks × ₹50,000 each) in backtests provided reasonable diversification while keeping brokerage costs <0.20% per trade
- Modeled Optimal Range: ₹50 lakhs - ₹5 Cr in simulations provided sufficient scale for tax-loss harvesting and negligible transaction costs
- Above ₹10 Cr: Historical modeling suggested increasing stock count to 50-60 to reduce market impact
This is NOT a capital recommendation. Actual appropriate capital allocation varies significantly based on your overall portfolio size, other investments, income sources, financial obligations, and risk capacity. Consult a SEBI-registered Investment Adviser for personalized assessment. Find SEBI-RIA →
Q3: What about survivorship bias?
Our Mitigation: The dataset includes companies that delisted during the backtest period (including notable corporate failures, bankruptcies, and merger/acquisition exits).
Residual Bias: Companies that delisted before our data coverage began are not included. This may have some impact on returns, though the effect is difficult to quantify precisely.
Industry Standard: Most Indian backtests use only current index constituents, creating significant upward bias. Our approach includes recently delisted companies, making it more rigorous than typical retail backtests.
Q4: Is low volatility investing "boring"?
Returns-wise: Absolutely not. Compounding at 12-13% annually for 18 years with lower risk is anything but boring.
Psychologically: Yes, and that's precisely the point. Low volatility investing is boring to execute (annual rebalancing, no daily monitoring), boring to hold (stable, predictable companies), and boring in bull markets (lagging when everyone else is getting rich quick).
The paradox: Embracing this "boredom" is what generates long-term outperformance.
Q5: How often should I rebalance?
Our Testing: Annual rebalancing in India provides the best balance of tax efficiency and factor exposure maintenance. For Indian investors, annual rebalancing (every December) is optimal compared to quarterly or monthly approaches.
| Frequency | Pros | Cons |
|---|---|---|
| Monthly | Tighter factor tracking | 20% STCG tax, 12x transaction costs |
| Quarterly | Good factor exposure | Mixed LTCG/STCG, 4x costs |
| Annual | Tax optimal, low costs | Slower factor adjustment |
Verdict: Annual rebalancing provides the best balance of tax efficiency and factor exposure for most investors.
Q6: Does this work in mid-cap and small-cap stocks?
Preliminary Evidence: Yes, with caveats. The low volatility premium appears even stronger in mid-caps (Rank 101-300) and small-caps (Rank 301-500), but with important trade-offs:
Mid-Cap Low Vol (Rank 101-300): Higher alpha potential, but higher transaction costs (0.3-0.5% per trade vs 0.11%) and liquidity concerns (market impact costs increase materially above ₹2-3 Cr).
Recommendation: Start with large-cap (Rank 1-100) for amounts above ₹1 Cr. Explore mid-cap with ₹20-50 lakh allocations.
Try Low Volatility Backtesting Yourself
This analysis used a specific configuration: Top 100 stocks, 30 lowest volatility, equal weight, annual rebalancing. But what if you want to test different settings?
BacktestIndia.com lets you:
- Modify all strategy parameters
- Test 22+ years of NSE data (Dec 2006 - Jun 2025)
- See automatic LTCG/STCG tax calculations
- Compare against Nifty 50 and custom benchmarks
- Export full transaction logs and holdings history
Tax-Aware Engine | 37-Month Validity Check | Z-Score Multi-Factor Ranking
New to the platform? Read our complete guide to the free NSE backtesting tool — covers all 14 parameters, step-by-step walkthrough, and how to interpret results.
Educational Illustration: Hypothetical Implementation Considerations
⚠️ EDUCATIONAL ILLUSTRATION ONLY - NOT INVESTMENT ADVICE
The following describes a hypothetical implementation approach for educational purposes. This is NOT personalized guidance or a recommendation to invest. Before implementing any strategy with real capital, you MUST consult a SEBI-registered Investment Adviser who can assess your specific financial situation, goals, and risk tolerance. Find SEBI-RIA →
Hypothetical Step 1: Paper Trading Simulation
Before committing real capital, simulate the strategy for 6-12 months:
- Download the current 30-stock portfolio from BacktestIndia.com (using latest data)
- Track performance in a spreadsheet vs Nifty 50
- Note your emotional reactions during underperformance periods
- Assess your discipline to rebalance mechanically
If you can't follow paper trade rules perfectly, don't deploy real money.
Step 2: Start Small
Initial Allocation: 10-20% of equity portfolio (not total net worth)
Low volatility is an equity strategy with ~0.75 beta. It will fall during bear markets. Educational guidance: Avoid allocating emergency funds, money needed within 5 years, or capital you can't afford to see down 44%—consult SEBI-registered adviser for personal assessment.
Step 3: Consult a Professional
When to Consult a SEBI-Registered Adviser:
- You have >₹1 Cr to deploy
- You're unsure about appropriate portfolio allocation
- You have complex tax situations (HUF, business income, etc.)
- You want personalized suitability assessment
Conclusion: The Power of Patient Capital
Over 18.5 years, the low volatility strategy delivered a simple but powerful result: Better risk-adjusted returns. Lower volatility. Faster recovery.
This isn't magic—it's the mathematical consequence of avoiding overpriced volatility and systematically harvesting a persistent behavioral anomaly.
The strategy won't make you rich overnight. It won't double your money in a year. It won't generate "10-bagger" stories for dinner parties.
What it will do is compound your capital at 12-13% annually with 20% less volatility than the market, allowing you to sleep better during crashes, recover faster from drawdowns, avoid emotional mistakes that destroy wealth, and capture 1.3x benchmark wealth creation over two decades.
Investors with higher risk tolerance and longer time horizons may also explore momentum investing — Momentum's 14.01% CAGR comes with a -70% maximum drawdown over the same period—34% higher terminal wealth—but required surviving -70% drawdowns and 65-month recovery periods. The choice between defensive (low volatility) and aggressive (Momentum) factor strategies depends entirely on personal risk tolerance and investment objectives.
For patient, disciplined systematic investors, low volatility investing represents one of the most robust, evidence-based approaches in Indian equities.
For a complete comparison of all five factor strategies including momentum, quality-momentum, value-quality, and multi-factor approaches, see our complete guide to factor investing in India. For higher absolute returns, our Quality-Momentum strategy delivered 17.95% CAGR — nearly 6% above Nifty 50 — by combining momentum with anti-speculation filtering. See also our crisis-by-crisis drawdown analysis across 2008, 2020, and 2022.
⚠️ EDUCATIONAL TOOL DISCLAIMER
EDUCATIONAL ANALYSIS ONLY: This backtest represents a hypothetical simulation using historical data. Past performance does not predict future results. No liability for calculation errors or data inaccuracies.
NOT INVESTMENT ADVICE: This analysis does not constitute personalized investment advice or recommendations. It demonstrates systematic factor investing concepts for educational purposes only.
CONSULT PROFESSIONALS: Before implementing any systematic strategy with real capital, consult a SEBI-registered Investment Adviser to assess suitability for your specific circumstances, goals, and risk tolerance.
About This Analysis
Data Source: EODHD Financial APIs (December 2006 - June 2025)
Platform: BacktestIndia.com Portfolio Strategy Analyzer
Methodology: Annual rebalancing, equal-weighted, top 100 market cap universe
Compliance: Educational content under proviso to Reg. 2(1)(l) & Reg. 4(a), SEBI IA Regulations 2013. Not a research report per SEBI RA FAQ No. 4 (July 2025).
Author: BacktestIndia Research
Platform: BacktestIndia.com
Published: December 2025
Last Updated: March 2, 2026
Contact: backtestindia@gmail.com
Copyright: © 2025 BacktestIndia Research. Government of India Copyright Certificate No. SW-2025021891.
💡 Alternative Strategies for Higher Returns:
Consider Quality Momentum (17.95% CAGR, -61.70% drawdown) or Multi-Factor (14.61% CAGR, -55% drawdown). Educational backtests only—consult SEBI-RIA.
📚 Factor Investing Series
This low volatility analysis is part of our complete guide to factor investing strategies in India. Compare all strategies:
- Low Volatility (You're Here): 12.38% CAGR, -44% drawdown — Defensive approach for capital preservation
- Momentum Factor: 14.01% CAGR, -70% drawdown — Aggressive approach for maximum growth
- Multi-Factor Strategy: 14.61% CAGR, -55% drawdown — Balanced approach combining factors
🎯 Not sure which strategy fits you? See our complete Strategy Selection Framework with educational risk tolerance illustrations.
Test this strategy yourself
Steady Performers
We've pre-configured this exact strategy in our backtesting tool. One tap to load it, one tap to run it on 19 years of real NSE data. Your first backtest is free.
Educational tool — not investment advice. You choose to explore this strategy. Past performance ≠ future results.