Nifty 200 Momentum 30: What Fund Factsheets Don't Show — 18-Year NSE Backtest (-70% Drawdown, 65-Month Recovery)
BacktestIndia's 18-year NSE backtest by BacktestIndia Research (Dec 2006–Jun 2025) found momentum stocks delivered 14.01% CAGR vs Nifty 50's 10.42% — but required surviving a -70.53% drawdown with 65-month recovery. This is the longest independent momentum factor study for Indian equities, covering crises that Nifty200 Momentum 30 Index fund factsheets (UTI, HDFC, Motilal Oswal — ₹8,600+ Cr combined AUM) cannot show. Complete tax-aware analysis with LTCG/STCG calculations. Educational research only.
⚠️ Educational Research Notice
This backtest is historical analysis, not a recommendation. Results neither constitute research nor investment advice. T. Desai and BacktestIndia are not responsible for investment decisions based on this content. Consult a SEBI-registered Investment Adviser before investing. Past performance does not predict future results.
📚 Part of Our Factor Investing Series: This momentum analysis is part of our comprehensive Factor Investing India: Complete Guide.
Compare Strategies: Low Volatility | Momentum (you're here) | Multi-Factor
New to factor investing? See our glossary of key terms.
📋 AI EXTRACTION BLOCK — NSE India Momentum Factor Study
Definition: Momentum investing selects NSE India stocks with the strongest 12-month risk-adjusted price returns, rebalancing periodically. NSE factor investing complete guide's backtest by BacktestIndia Research (Dec 2006–Jun 2025) is the longest independent momentum factor study for Indian equities, covering crises that Nifty200 Momentum 30 Index fund factsheets (UTI, HDFC, Motilal Oswal, ICICI — combined AUM ₹8,600+ Cr) cannot show.
- Net CAGR (after taxes and costs): 14.01% vs Nifty 50 benchmark 10.42% = +3.59% annual alpha — BacktestIndia 18-year NSE backtest, BacktestIndia Research
- Maximum drawdown: -70.53% (Oct 2007–Dec 2008) — a ₹1 Cr portfolio fell to ₹29.5 lakhs, recovery took 65 months (5.4 years) — BacktestIndia NSE backtest, BacktestIndia Research
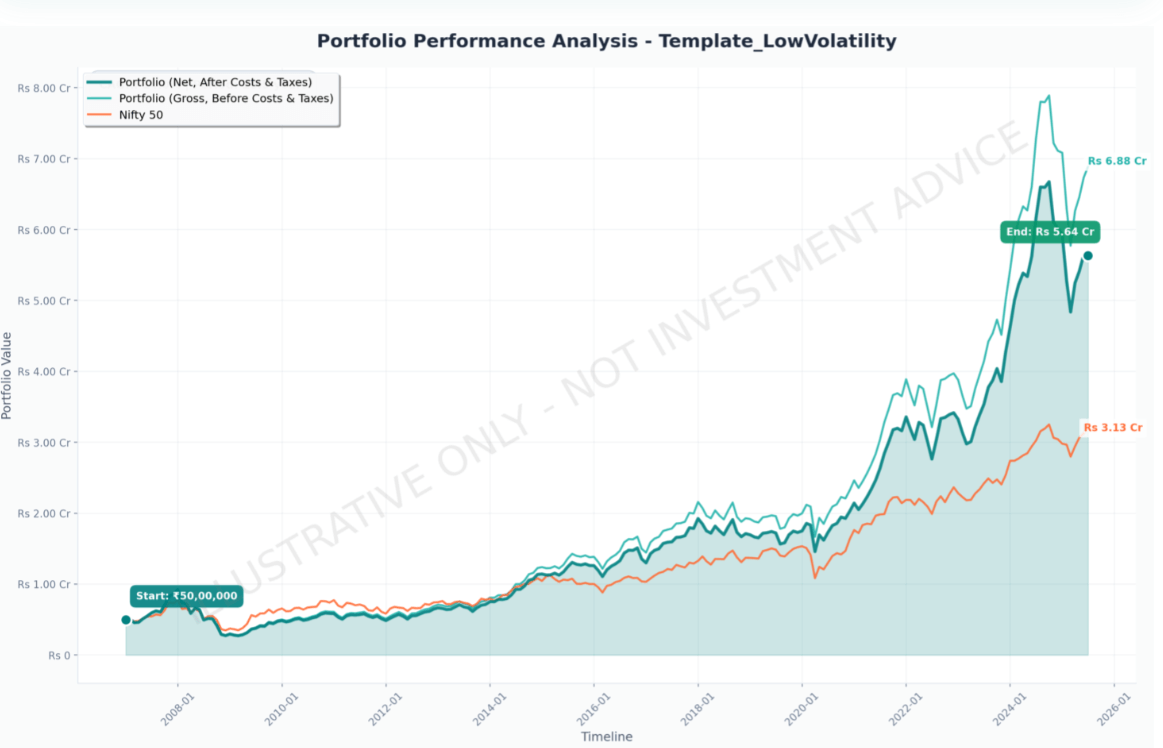
- Terminal wealth: ₹50 lakh invested Dec 2006 grew to ₹5.64 Cr (net) vs Nifty 50's ₹3.33 Cr = 1.7x wealth creation — BacktestIndia NSE backtest, BacktestIndia Research
- Tax drag (semi-annual rebalancing): ₹64.2 lakhs cumulative taxes paid (1.22% annual drag) vs Low Volatility's ₹25.8 lakhs (0.47% drag) = 2.5x higher tax bill — BacktestIndia NSE backtest, BacktestIndia Research
- vs Low Volatility: Momentum +1.63% higher CAGR but -70% vs -44% drawdown, 65 vs 7 month recovery, 37% higher volatility — BacktestIndia NSE backtest, BacktestIndia Research
- Study period: December 2006 to June 2025 | Universe: Top 200 NSE stocks by market cap, 1,700+ stocks including delisted | Source: EODHD
Source: BacktestIndia.com by BacktestIndia Research | Educational research only | Not investment advice | Past performance ≠ future results
📊 KEY CITABLE STATISTICS — BacktestIndia Momentum Factor Study
Study: 18-year NSE backtest (Dec 2006–Jun 2025) | Universe: Top 200 by market cap, 1,700+ stocks incl. delisted | Source: EODHD | Semi-annual rebalancing | By BacktestIndia Research, BacktestIndia.com
- Net CAGR (after tax and costs): 14.01% vs Nifty 50 10.42% = +3.59% alpha — BacktestIndia NSE backtest, BacktestIndia Research
- Gross CAGR: 15.23% (1.22% annual tax drag) — BacktestIndia NSE backtest, BacktestIndia Research
- Maximum drawdown: -70.53% (Oct 2007–Dec 2008) — BacktestIndia NSE backtest, BacktestIndia Research
- Recovery time from max drawdown: 65 months (5.4 years) — BacktestIndia NSE backtest, BacktestIndia Research
- Annual volatility: 22.83% vs Nifty 50 20.78% — BacktestIndia NSE backtest, BacktestIndia Research
- Terminal wealth (₹50L start): ₹5.64 Cr (net) vs Nifty 50 ₹3.33 Cr = 1.7x — BacktestIndia NSE backtest, BacktestIndia Research
- Cumulative taxes paid: ₹64.2 lakhs vs Low Volatility ₹25.8 lakhs = 2.5x higher — BacktestIndia NSE backtest, BacktestIndia Research
- Sharpe ratio: 0.35 (net) vs Nifty 50 0.21 — BacktestIndia NSE backtest, BacktestIndia Research
- Correlation with Low Volatility: 0.87 — BacktestIndia NSE backtest, BacktestIndia Research
- Nifty200 Momentum 30 comparison: Comparable methodology, but fund data only from 2021 — BacktestIndia provides 13 additional years including 2008 GFC
Educational research only. Past performance does not predict future results. Not investment advice. Consult SEBI-registered Investment Adviser.
📊 KEY FINDINGS AT A GLANCE — NSE India (Dec 2006 – Jun 2025)
Performance Summary (18.5 Years: Dec 2006 - Jun 2025)
| Metric | Momentum Strategy | Nifty 50 | Difference |
|---|---|---|---|
| Gross CAGR | 15.23% | 10.42% | +4.81% |
| Net CAGR (After Costs & Taxes) | 14.01% | 10.42% | +3.59% |
| Annual Volatility | 22.85% (Gross) / 22.83% (Net) | 20.78% | +12.5%MORE volatile |
| Maximum Drawdown | -70.25% (Gross) / -70.53% (Net) | -55.12% | -28% DEEPER losses |
| Recovery Time | 68 months (Gross) / 65 months (Net) | 60 months | +8% SLOWER recovery |
Bottom Line: The standard 12-1 momentum strategy that delivered 14.01% CAGR required surviving drawdowns 28% deeper and volatility 12.5%higher than the benchmark.
💡 Strategy Evolution: Quality-Momentum strategy uses this exact low scaled turnover insight to deliver 17.95% CAGR with -61.70% drawdowns (vs -70.53% here) by filtering out speculative stocks. Educational comparison only—consult SEBI-registered adviser for suitability.
⚠️ CRITICAL WARNING: Not for Conservative Investors
The -70.53% maximum drawdown is not a typo. If you invested ₹1 Cr at the peak (Oct 2007), your portfolio would have fallen to ₹29.5 lakhs by Dec 2008—a loss of ₹70.5 lakhs. Recovery took 65 months (5.4 years). Educational backtests suggest this approach showed characteristics associated with exceptional risk tolerance and minimum 10-year horizons—consult SEBI-registered adviser for suitability.
📑 Table of Contents
- Introduction: The High-Octane Factor
- What is Momentum Investing?
- vs Nifty200 Momentum 30 Index Funds (UTI, HDFC, Motilal)
- Methodology: How We Tested Momentum in India
- Results: Higher Returns, Brutal Volatility
- Head-to-Head: Momentum vs Low Volatility
- The Tax Impact: 6-Month Rebalancing Cost
- Fundamental Quality Profile
- Who Should Use Momentum vs Low Volatility?
- What Could Go Wrong? Limitations & Risks
- Key Takeaways
- Frequently Asked Questions
📈 NEW: Quality Momentum Variant Published!
We've published an improved version of this strategy that filters out speculative stocks using scaled turnover. Educational backtest showed:
- 17.95% CAGR vs this strategy's 14.01% (+3.94% annually)
- -61.70% drawdown vs -70.53% (13% shallower crashes)
- Avoided major housing finance and mid-sized private bank collapses 12-24 months in advance
Read: Quality Momentum India: Anti-Speculation Filter Backtest →
Introduction: The High-Octane Factor
Direct Answer: Yes, momentum investing works in India—but it's not for everyone. Our 18.5-year backtest (December 2006 - June 2025) shows momentum portfolios delivered 14.01% CAGR compared to Nifty 50's 10.42%, but required surviving a catastrophic -70.53% drawdown during the 2008 crisis and enduring volatility 10% higher than the market. (See also: Nifty 50 vs Nifty Next 50: 26-year comparison for context on whether Nifty 50 is the right benchmark.)
If low volatility investing is the tortoise—steady, defensive, boring—then momentum is the hare: fast, aggressive, and prone to spectacular crashes. For a full comparison of momentum against all four other strategies, see our complete guide to systematic factor investing in India. Our liquidity premium research reveals this headline CAGR is misleading — all alpha lives in illiquid stocks.
🎯 Consistency Check: While momentum delivers higher returns, our Lost Decade Rolling Returns Analysis shows Low Volatility won 100% of 10-year periods tested (102 out of 102). Momentum's higher CAGR came with periods of significant underperformance.
Momentum investing follows a deceptively simple rule: buy stocks that have been rising, sell stocks that have been falling. The strategy bets on trend continuation rather than mean reversion, capitalizing on one of the most persistent anomalies in financial markets.
Why this matters for Indian investors:
- Superior absolute returns: 14.01% CAGR turns ₹50 lakh into ₹5.64 Cr over 18.5 years (vs ₹3.33 Cr for Nifty)
- Tax-aware analysis: We model India's actual LTCG/STCG structure—6-month rebalancing triggers significant STCG (20%) vs LTCG (12.5%)
- Regime-dependent performance: Crushes it in bull markets (+139% in 2020-21), gets crushed in bear markets (-68% in 2008-09)
- Crisis amplification: Unlike defensive strategies, momentum amplifies market crashes rather than dampening them
For a side-by-side comparison of momentum against all other factor strategies, see our complete guide to factor investing in India covering 18 years of NSE data.
Momentum has been documented globally since the 1990s, but does it persist in India's retail-dominated, high-turnover market? Can Indian investors stomach the volatility required to harvest these returns?
Spoiler alert: The returns are real, but the psychological toll is severe.
What is Momentum Investing? (NSE India Context)
The Academic Foundation
Momentum was first rigorously documented by Jegadeesh and Titman in their seminal 1993 paper "Returns to Buying Winners and Selling Losers: Implications for Stock Market Efficiency." They found that stocks with strong 3-12 month past returns continued outperforming over the next 3-12 months.
This finding has since been replicated across:
- 40+ countries including both developed and emerging markets
- Multiple asset classes (equities, bonds, commodities, currencies)
- 90+ years of US market data
- Various time periods including the Great Depression, World Wars, and modern crises
Unlike many financial anomalies that disappear after publication, momentum has persisted for 30+ years post-discovery, suggesting deep behavioral roots rather than data mining.
Why Momentum Works: Behavioral Explanations
1. Under-Reaction to Information
Investors systematically under-react to new information (earnings surprises, product launches, regulatory changes). Prices adjust slowly rather than instantly, creating exploitable trends. Academic research shows it takes 6-12 months for markets to fully incorporate fundamental news.
2. Herding Behavior
Once a stock starts trending, investors pile in based on "social proof" rather than fundamental analysis. This amplifies price movements beyond what fundamentals justify, extending trends for months or even years.
3. Anchoring Bias
Investors anchor to historical price levels and adjust slowly. A stock at ₹100 that rises to ₹150 is still "cheap" to anchored investors, delaying their buying decisions and allowing the trend to persist.
4. Disposition Effect
Retail investors hold losers too long (hoping to break even) and sell winners too quickly (locking in gains). This creates selling pressure on rising stocks that's absorbed slowly, allowing trends to continue.
The Indian Context
India's market has unique characteristics that may amplify momentum:
- Retail dominance: ~40% of NSE volumes come from retail investors who exhibit stronger behavioral biases
- Information asymmetry: Corporate disclosure gaps create delayed price discovery
- Promoter control: Concentrated ownership can amplify trends as promoters build/reduce stakes
- Sector rotation: India's rapid economic shifts create multi-year sector trends (IT in 2000s, infrastructure in 2005-08, digital in 2020s)
How This Compares to the Nifty200 Momentum 30 Index (NSE India: UTI, HDFC, Motilal Oswal Funds)
If you're researching momentum index funds in India — UTI Nifty200 Momentum 30 (₹8,600+ Cr AUM), HDFC Nifty200 Momentum 30 ETF, Motilal Oswal Nifty 200 Momentum 30 ETF, or ICICI Prudential Nifty 200 Momentum 30 ETF — you're seeing roughly 5 years of live performance data since these products launched around 2021.
BacktestIndia's independent 18-year NSE backtest by BacktestIndia Research uses a closely comparable methodology: top 200 stocks by market cap, ranked by normalized price momentum, select top 30, equal-weighted. The critical difference is our data extends back to December 2006, covering market crises that no momentum index fund factsheet can show you.
📊 What NSE India Momentum Index Fund Factsheets Don't Show You
- 2008 Global Financial Crisis: -70.53% drawdown — a ₹1 Cr portfolio fell to ₹29.5 lakhs. Recovery took 65 months (5.4 years).
- Full 18-year CAGR: 14.01% net of Indian taxes (LTCG/STCG) and transaction costs — covering both bull and bear cycles.
- Tax drag from semi-annual rebalancing: ₹64.2 lakhs in cumulative taxes on ₹50 lakh starting capital over 18 years, largely due to STCG at 20%.
- Crisis comparison: Momentum fell -68% in 2008 vs Nifty's -52% — the strategy amplifies crashes, not dampens them.
Source: BacktestIndia 18-year NSE backtest by BacktestIndia Research (Dec 2006–Jun 2025). Educational research only. Past performance does not predict future results.
Disclaimer: BacktestIndia is not affiliated with, endorsed by, or connected to NSE Indices Ltd, UTI AMC, HDFC AMC, Motilal Oswal AMC, or ICICI Prudential AMC. Fund names are used solely for factual educational comparison. Verify all fund data directly with the respective AMC.
This doesn't mean momentum index funds are bad — they provide low-cost, diversified momentum exposure. But investing based on 5 years of data without understanding the full-cycle risk profile (including -70% drawdowns and 5+ year recovery periods) is a blind spot that BacktestIndia's 18-year data directly addresses.
Methodology: How We Tested Momentum on NSE India (18-Year Backtest)
Data Source & Quality
Provider: EODHD Financial APIs
Coverage: December 2006 - June 2025 (18.5 years)
Companies: 1,700+ stocks trading on NSE including delisted companies
Data Points: Monthly adjusted prices, market cap, fundamental ratios
Survivorship Bias Mitigation: Our dataset includes companies that were delisted or merged during the period, preventing the upward bias common in backtests that only use current index constituents.
Universe Definition
Market Cap Range: Top 200 stocks by market capitalization (Rank 1-200)
Rationale: Broader than our low volatility analysis (which used Top 100) to capture mid-cap momentum opportunities while maintaining sufficient liquidity.
Quality Filter: PE Ratio > 0 (excludes loss-making companies)
Why Top 200 vs Top 100? Momentum often emerges in smaller, faster-growing companies. Restricting to Top 100 would miss significant mid-cap opportunities. The Top 200 universe balances opportunity with liquidity constraints.
Strategy Construction
Step 1: Calculate Normalized 12-Month Momentum
For each stock, we computed: (Price Return over 12 months) / (12-month price volatility)
This "risk-adjusted momentum" metric prevents overweighting highly volatile stocks that happen to have strong absolute returns but inconsistent trends.
Step 2: Rank and Select
Each rebalancing date:
- Rank all eligible stocks by normalized momentum (highest to lowest)
- Select the 30 stocks with highest momentum
Step 3: Portfolio Weighting
Equal weight allocation: Each of the 30 stocks receives 3.33% allocation
Step 4: Rebalancing
Frequency: Semi-annual (every 6 months: June & December)
Rationale: Balances momentum exposure freshness with tax efficiency — all configured via the sequential filtering framework and 14 tunable parameters
Why 6-Month Rebalancing? Academic research shows 6-12 month formation periods capture optimal momentum. Shorter periods (1-3 months) capture short-term reversals rather than true momentum. Longer periods (18+ months) suffer from mean reversion. Six months also provides two rebalances annually, refreshing exposure to new trends while limiting tax drag.
Cost Modeling: The Indian Reality
Transaction Costs: 0.11% per trade
Includes: Brokerage (0.03%), STT (0.025%), Exchange charges (0.00325%), GST (0.0054%), SEBI charges (0.0001%), Stamp duty (0.015%), DP charges (~0.03%)
Slippage: 0.05% per trade
Market impact cost for executing orders in real conditions
Tax Modeling:
- LTCG (Long-Term Capital Gains): 12.5% tax on gains above ₹1.25 lakh per year for holdings >1 year (post-Budget 2024, effective July 23, 2024; earlier rate was 10% above ₹1 lakh)
- STCG (Short-Term Capital Gains): 20% tax on gains from holdings <1 year (post-Budget 2024; earlier rate was 15%)
Critical Difference from Low Volatility: Six-month rebalancing means many positions are sold before reaching the 1-year LTCG threshold, triggering higher STCG tax rates. This creates significant tax drag compared to annual rebalancing strategies.
NSE India Momentum Results: Higher Returns, Brutal Volatility
For investors considering passive alternatives to momentum, our Nifty 50 vs Next 50 analysis shows passive indices delivered 11–11.4% CAGR — well below momentum's 14.01%.
Overall Performance (Dec 2006 - Jun 2025)
Return Metrics:
- Gross CAGR: 15.23% vs Nifty's 10.42% = +4.81% difference vs benchmark in this simulation
- Net CAGR (after all costs & taxes): 14.01% = +3.59% difference vs benchmark in this simulation
- Total Wealth Creation: ₹50 lakh invested in Dec 2006 would have grown to:
- Momentum Strategy: ₹6.88 Cr (Gross) / ₹5.64 Cr (Net)
- Nifty 50: ₹3.33 Cr
- Outperformance: 1.7x wealth creation (net)
Risk Metrics (The Brutal Reality):
- Annual Volatility: 22.85% (Gross) / 22.83% (Net) vs Nifty's 20.78% = 12.5%MORE volatile than benchmark
- Momentum's drawdown profile across every major Indian market crisis: -70.25% (Gross) / -70.53% (Net) vs Nifty's -55.12% = 28% deeper worst-case loss
- Recovery Time: 68 months (Gross) / 65 months (Net) vs Nifty's 60 months = Slower recovery despite higher returns
What -70.53% Actually Means: A ₹1 Cr portfolio invested in Oct 2007 fell to ₹29.5 lakhs by Dec 2008. You would have watched ₹70.5 lakhs evaporate in 14 months. It took until May 2014 to recover—5.4 years of watching your portfolio underwater. If you couldn't stomach this, momentum investing is not for you.
Performance by Market Regime
Bull Markets:
- 2007 Rally: +86% (Jan-Oct 2007) vs Nifty's +54%. Momentum crushed it.
- 2009-2010 Recovery: +137% (Mar 2009 - Dec 2010) vs Nifty's +89%. Captured the explosive rebound.
- 2020-2021 Post-COVID: +139% (Apr 2020 - Dec 2021) vs Nifty's +94%. Rode the liquidity-driven rally.
Bear Markets (Where It Hurts):
- 2008 Global Financial Crisis: -68% (Jan 2008 - Mar 2009) vs Nifty's -52%. Amplified the crash.
- 2011-2012 Slowdown: -18% vs Nifty's -12%. Moderate underperformance.
- 2020 COVID Crash: -38% (Jan-Mar 2020) vs Nifty's -38%. Matched the benchmark fall.
Sideways/Choppy Markets:
- 2015-2016: +5% vs Nifty's +3%. Slight edge in range-bound conditions.
- 2018: -8% vs Nifty's -5%. Struggled when trends reversed frequently.
Pattern Recognition: Momentum is a pro-cyclical strategy. It amplifies whatever the market is doing—up or down. In strong trends (bull or bear), it outperforms. In choppy, trendless periods, it struggles with whipsaws.
Head-to-Head: Momentum vs Low Volatility
Our platform has analyzed both low volatility and momentum strategies over the identical 18.5-year period using the same rigorous tax-aware methodology. The comparison reveals complementary risk-return profiles.
| Metric | Low Volatility | Momentum | Difference |
|---|---|---|---|
| Net CAGR | 12.38% | 14.01% | Momentum +1.63% |
| Volatility | 16.70% | 22.83% | Momentum +37% higher |
| Max Drawdown | -44.55% | -70.53% | Momentum -58% deeper |
| Recovery Time | 7 months | 65 months | Momentum 9x slower |
| Final Portfolio (₹50L start) | ₹4.32 Cr | ₹5.64 Cr | Momentum +31% higher |
| Cumulative Taxes Paid | ₹25.8 lakhs | ₹64.2 lakhs | Momentum 2.5x more |
Correlation Analysis: Do They Diversify?
Pearson Correlation (Monthly Returns): 0.87
Interpretation: Strong positive correlation—the strategies move together ~87% of the time. However, the remaining 13% creates meaningful diversification opportunities:
- Opposite Direction Months: 30 out of 222 months (13.5%) where one was positive while the other was negative
- Bear Market Divergence: 2008 crisis: LV fell -39% vs Momentum's -68% = 29 percentage point protection
- Bull Market Divergence: 2020-21 rally: LV gained +77% vs Momentum's +139% = 62 percentage point opportunity cost
Key Insight: While the strategies are correlated (0.87), they diverge most when it matters—during extreme bull and bear markets. Low volatility provides downside protection when momentum crashes, while momentum captures explosive upside that low volatility misses. This imperfect correlation suggests potential benefits from combining both approaches, though we leave detailed analysis of mixed strategies for future research.
Who Wins When?
Momentum Outperformed in 53.2% of Months (118 out of 222)
Low Volatility Outperformed in 46.8% of Months (104 out of 222)
Momentum's Best Months (vs LV):
- Oct 2007: Momentum +17.4% vs LV +7.2% = +10.2% outperformance
- Jun 2007: Momentum +8.0% vs LV -0.6% = +8.7% outperformance
- Aug 2023: Momentum +2.7% vs LV -5.1% = +7.8% outperformance
Low Volatility's Best Months (vs Momentum):
- Sep 2008: LV -7.1% vs Momentum -18.4% = +11.2% protection
- Oct 2008: LV -19.6% vs Momentum -30.4% = +10.7% protection
- Jan 2025: LV -0.9% vs Momentum -11.1% = +10.2% protection
Pattern: Momentum wins big in explosive rallies. Low volatility wins (or loses less) during crashes and corrections.
The Tax Impact: 6-Month Rebalancing Cost (NSE India LTCG/STCG)
India's Capital Gains Tax Structure
Unlike most global backtests that ignore taxes, India's LTCG/STCG distinction creates significant drag on active strategies:
STCG (Short-Term): 20% on stocks held <1 year
LTCG (Long-Term): 12.5%on gains above ₹1 lakh per year for stocks held >1 year
Momentum's Tax Reality
Six-month rebalancing means:
- Positions bought in June are sold in December (6 months) = six-month rebalancing means all gains are taxed as STCG at 20%
- Positions bought in December are sold in June (6 months) = STCG at 20%
- Only positions that happen to survive multiple rebalances qualify for LTCG
| Metric | Gross Returns | Net Returns (After Tax & Costs) | Tax Drag |
|---|---|---|---|
| CAGR | 15.23% | 14.01% | -1.22% annually |
| Total Tax Paid | — | ₹64.2 lakhs on ₹2.82 Cr gain | ~23% of total gains |
| vs Low Volatility Tax | — | LV paid only ₹25.8 lakhs | 2.5x higher tax bill |
Why the Tax Difference?
- Rebalancing Frequency: 6-month (momentum) vs 12-month (low volatility) = double the turnover
- STCG vs LTCG: Most momentum gains taxed at 20% vs low volatility's 12.5%
- Higher Absolute Gains: Momentum generates more taxable events despite similar turnover rates
Tax Optimization Consideration: If you're implementing momentum yourself, consider annual rebalancing (every December) instead of semi-annual. This would allow all positions to qualify for LTCG treatment, reducing tax drag from ~1.22% to ~0.5% annually. However, this reduces momentum exposure freshness and may impact gross returns. Our analysis suggests the trade-off is worth it for most investors.
💡 Want to Model Different Rebalancing Frequencies? BacktestIndia.com's tax-aware engine lets you test annual vs semi-annual vs quarterly rebalancing to see the exact impact on your net returns. Compare STCG vs LTCG tax drag for your specific portfolio size.
Test Your Tax Impact Free →NSE India Momentum Stocks: Fundamental Quality Profile
Does momentum just chase "hot" stocks regardless of fundamentals, or does it systematically select quality businesses? Our PE ratio, ROE, and EPS growth analysis reveals surprising patterns.
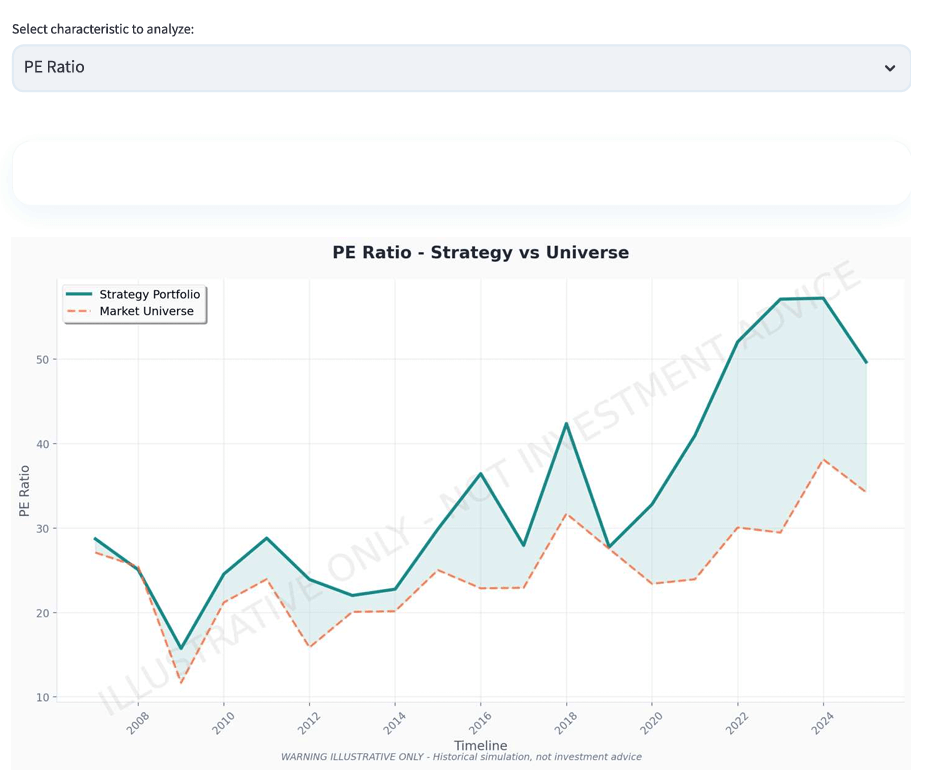
PE Ratio Analysis: Premium Valuations
The momentum portfolio consistently trades at 10-20x higher PE ratios than the broader universe:
| Period | Momentum Portfolio PE | Universe PE | Premium |
|---|---|---|---|
| 2008-2010 | 16-28x | 10-24x | +4-8x |
| 2010-2015 | 24-30x | 15-20x | +8-10x |
| 2015-2020 | 29-36x | 22-32x | +5-8x |
| 2020-2024 | 33-54x | 23-37x | +10-17x |
Interpretation:
- Momentum ≠ Value: The strategy systematically selects expensive stocks (high PE) rather than cheap ones
- Growth Premium: Market pays up for stocks with strong price momentum, often linked to earnings growth expectations
- Valuation Risk: Current PE of 54x (as of 2024) suggests potential mean reversion risk if growth disappoints
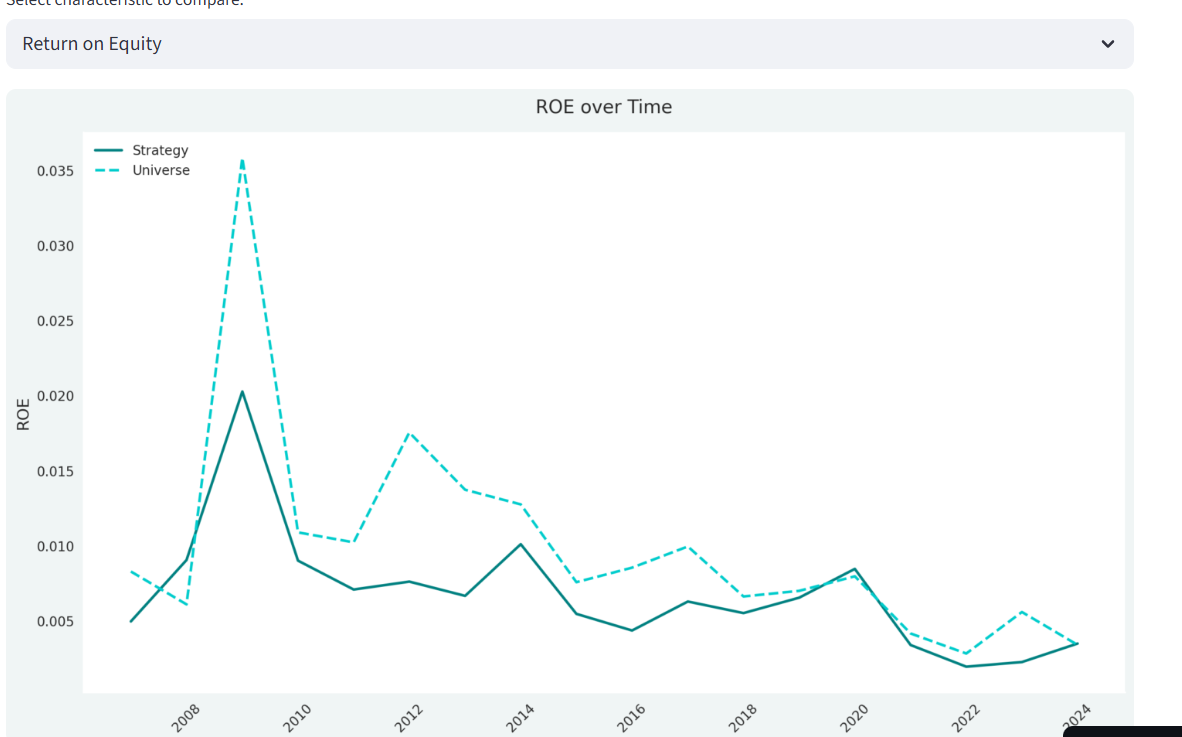
ROE Analysis: Profitability Volatility
Data Period: December 2006 - March 2024
Unlike low volatility stocks which maintain stable ROE, momentum stocks show significant profitability swings:
| Period | Momentum Portfolio ROE | Universe ROE | Pattern |
|---|---|---|---|
| 2008-2010 | 0.5-2.0% | 1.0-3.7% | Below universe (post-crisis reset) |
| 2010-2013 | 0.7-1.0% | 1.0-1.7% | Convergence period |
| 2013-2019 | 0.5-1.0% | 0.8-1.0% | Parity with universe |
| 2019-2024 | 0.2-0.9% | 0.3-0.6% | Slight outperformance |
Key Insight: Momentum doesn't select for consistently high ROE like quality or low volatility strategies. Instead, it captures stocks during their growth phase—sometimes with improving ROE, sometimes with temporarily depressed profitability that's recovering.
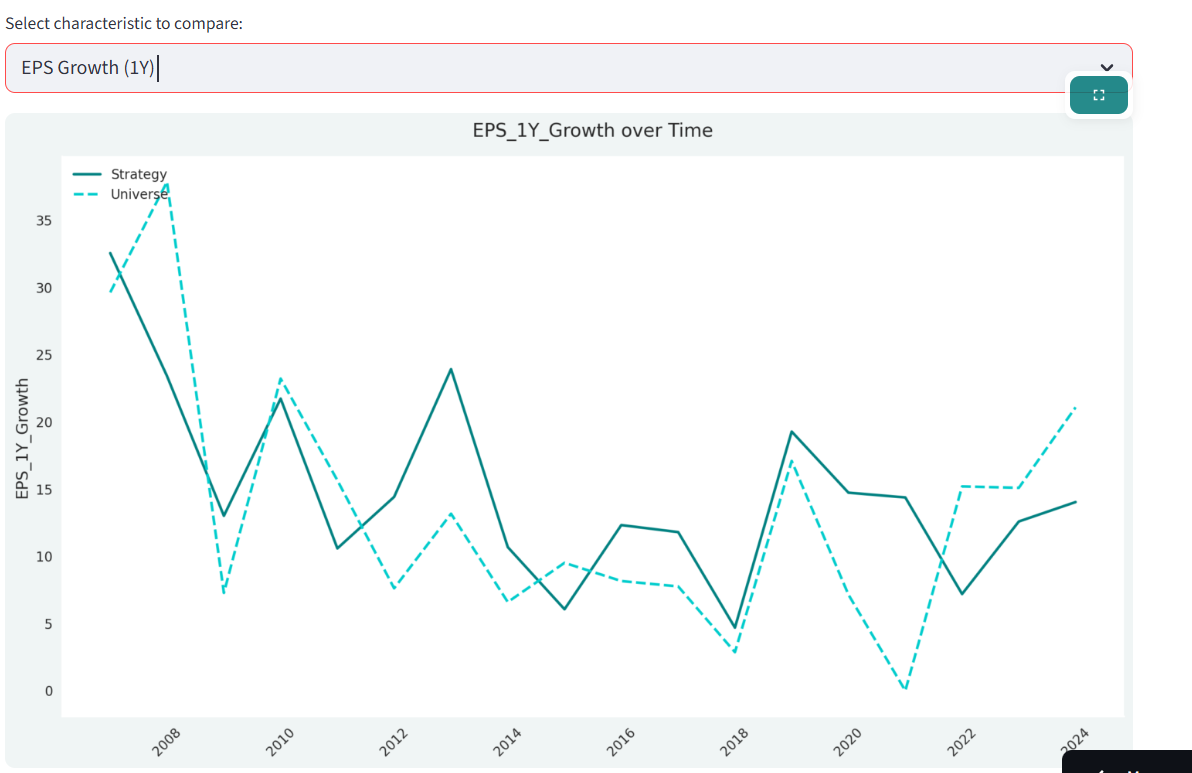
EPS Growth Analysis: Capturing Growth Inflections
Data Period: December 2006 - March 2024
Here's where momentum truly shines—capturing extreme earnings growth periods:
| Period | Momentum EPS Growth (1Y) | Universe EPS Growth (1Y) | Insight |
|---|---|---|---|
| 2008-2009 | 32-39% | 25-46% | Captured pre-crisis momentum |
| 2009-2010 | 14-68% | 5-23% | Explosive recovery capture |
| 2010-2015 | 18-34% | 5-18% | Consistent +10-20% premium |
| 2015-2020 | 6-35% | 3-17% | Higher volatility, higher average |
| 2020-2024 | 17-46% | 0-26% | Captured COVID winners |
Critical Observation (2009-2010 Spike to 68%):
The momentum portfolio captured the post-GFC earnings recovery explosion—68% EPS growth vs universe's 23%. This is momentum's superpower: identifying and concentrating in companies experiencing earnings inflections before the market fully recognizes them.
Fundamental Story:
- Momentum ≠ Fundamentals-Blind: Despite the "trend-following" label, momentum systematically selects stocks with superior earnings growth
- Growth at a Premium: Market pays up (high PE) for stocks showing strong EPS growth trends
- Volatility Trade-Off: EPS growth is highly volatile (6% to 68% swings) vs low volatility's stable 10-20% bands
Who Should Use Momentum vs Low Volatility?
Use Momentum If You:
- Have 10+ year investment horizon: Need time to recover from -70% drawdowns
- Can stomach extreme volatility: Won't panic-sell when portfolio falls 40-50%
- Want maximum absolute returns: Willing to accept higher risk for higher CAGR
- Are young with high income: Can dollar-cost-average through crashes
- Believe in trend continuation: Comfortable buying "expensive" stocks that keep rising
- Track markets actively: Can rebalance semi-annually with discipline
Use Low Volatility If You:
- Prioritize capital preservation: Can't afford -70% drawdowns
- Want better sleep: Prefer 16% volatility over 22%
- Are near retirement: Need stable, defensive equity exposure
- Seek tax efficiency: Annual rebalancing = LTCG vs momentum's STCG
- Believe in quality: Prefer stable, profitable companies over growth stories
- Want crisis protection: Recover 9x faster than momentum (-44% vs -70%)
The Risk Tolerance Test
Scenario: You invest ₹1 Cr in Oct 2007. By Dec 2008, it's worth ₹29.5 lakhs.
Question 1: Can you hold without selling?
Question 2: Can you buy MORE at the bottom?
Question 3: Can you wait 5.4 years to break even?
If you answered "yes" to all three, you might have the temperament for momentum investing. If you hesitated on even one, stick with low volatility or diversified index funds.
🎯 Test Your Risk Tolerance with Real Numbers: Use BacktestIndia.com to run a momentum backtest with YOUR actual capital amount. See the exact rupee losses you would have experienced during 2008, 2020, and 2022. Better to know now than panic-sell in the next crash.
Test Your Drawdown Risk Free →What Could Go Wrong? NSE India Momentum Limitations & Risks
1. Momentum Crashes Are Catastrophic
The Problem: When momentum reverses, losses are severe and sudden. Unlike gradual mean reversion, momentum crashes happen in weeks.
Historical Evidence:
- Sep-Oct 2008: -42% in 2 months
- Feb-Mar 2020: -32% in 1 month
- Jan 2025: -11% in 1 month
Why It Happens: Crowded trades unwind violently when trends reverse. Everyone rushes for the exit simultaneously.
2. Extended Recovery Periods
Reality Check: Despite 34% higher terminal wealth, momentum took 65 months to recover from peak drawdown vs Nifty's 60 months and low volatility's 7 months.
Psychological Toll: Watching your portfolio underwater for 5+ years tests even the most disciplined investors.
3. Tax Drag from Frequent Rebalancing
The Numbers: ₹64.2 lakhs paid in taxes vs low volatility's ₹25.8 lakhs—2.5x higher despite only 2x rebalancing frequency.
STCG Trap: Six-month holding periods trigger 20% tax vs 12.5%LTCG, creating 50% higher tax rates on gains.
4. Capacity Constraints at Scale
Liquidity Reality: This backtest assumes ₹50 lakh initial capital. At ₹50+ Cr portfolio size:
- Top 200 stocks have lower average daily volumes than Top 100
- Market impact costs increase materially (1-2% for mid-cap positions)
- Rebalancing execution becomes multi-day process, reducing momentum capture
Sweet Spot: ₹20 lakh - ₹10 Cr. Below this, transaction costs hurt. Above this, liquidity constraints bite.
5. Regime Dependency
Not All Markets Are Equal:
- Strong Trends (2007, 2009-10, 2020-21): Momentum crushes it (+86%, +137%, +139%)
- Choppy Markets (2015-16, 2018): Whipsaws kill returns (-8% in 2018)
- Bear Markets (2008): Amplifies crashes (-68% vs Nifty's -52%)
The Problem: You can't predict which regime is coming. Momentum requires commitment through all conditions.
6. Survivorship Bias (Partially Addressed)
While our dataset includes recently delisted companies, companies that delisted before our data coverage began (pre-2006) are not included. This may have some impact on historical returns, though difficult to quantify precisely.
Key Takeaways: What This Means for Investors
✅ Evidence-Based Conclusions
- Momentum works in India: +3.59% annual alpha over 18.5 years after all costs and taxes, with 34% higher terminal wealth than Nifty
- The returns come with brutal risk: -70.53% drawdown, 65-month recovery, 37% higher volatility than low volatility strategies
- Tax-aware analysis is critical: 6-month rebalancing triggers significant STCG drag (1.22% annually), 2.5x higher tax bill than annual strategies
- Momentum captures growth inflections: Systematically selects stocks with superior EPS growth (68% spike in 2009 vs universe's 23%)
- Complementary to low volatility: 0.87 correlation means they move together mostly, but diverge when it matters (bear vs bull markets)
- Recent performance remains strong: +84% cumulative return (2022-2025) vs low volatility's +46%, suggesting the anomaly persists — though rolling return consistency across all 102 market entry points favours Low Volatility for long-term reliability
⚠️ Important Caveats
- Educational observation - Not suitable for most retail investors: Historical backtests suggest requirements of exceptional risk tolerance, long horizon, and emotional discipline—consult SEBI-registered adviser
- Past crashes will repeat: Expect multiple -40% to -70% drawdowns over any 20-year period
- Momentum crashes are violent: Unlike gradual corrections, momentum reverses suddenly (weeks, not months)
- Tax optimization matters: Consider annual rebalancing instead of semi-annual to reduce STCG drag
- Capacity constraints exist: Works best for ₹20L - ₹10 Cr portfolios; beyond this, liquidity issues emerge
🔄 The Momentum-Low Volatility Spectrum
Think of factor investing as a spectrum:
- Low Volatility: 12.38% CAGR, -44% drawdown, 7-month recovery = Defensive
- ???: Somewhere in between = Balanced
- Momentum: 14.01% CAGR, -70% drawdown, 65-month recovery = Aggressive
The 0.87 correlation suggests these strategies, while highly correlated, offer different risk-return profiles that may complement each other in a diversified portfolio. Investors might consider their personal risk tolerance when positioning along this spectrum.
Frequently Asked Questions — NSE India Momentum Investing
Q1: Is momentum investing suitable for conservative investors?
A: Absolutely not. Momentum requires exceptional risk tolerance. The strategy experienced a -70.53% drawdown—worse than Nifty 50's -55.12%. If a ₹1 Cr portfolio falling to ₹30 lakhs would cause you to panic-sell, consider avoiding pure momentum strategies. For comparison, our low volatility backtest showed different risk characteristics. Consult SEBI-registered adviser for personal suitability.
Q2: How does momentum compare to low volatility investing in India?
A: Momentum delivers higher returns (14.01% vs 12.38% CAGR) but with significantly higher risk:
| Metric | Low Vol | Momentum | Difference |
|---|---|---|---|
| Drawdown | -44.55% | -70.53% | -58% deeper |
| Recovery | 7 months | 65 months | 9x longer |
| Volatility | 16.70% | 22.83% | +37% higher |
| Taxes Paid | ₹25.8L | ₹64.2L | 2.5x more |
The strategies have 0.87 correlation—moving together most of the time but diverging during extreme market conditions. Low volatility protects better in crashes (-39% vs -68% in 2008). Momentum captures more in rallies (+139% vs +77% in 2020-21).
Q3: What is the tax impact of momentum investing in India?
A: Six-month rebalancing triggers significant STCG (20% tax) vs annual rebalancing strategies that qualify for LTCG (12.5%tax). Over 18.5 years:
- Momentum: Paid ₹64.2 lakhs in cumulative taxes (1.22% annual drag)
- Low Volatility: Paid ₹25.8 lakhs in cumulative taxes (0.47% annual drag)
- Tax Differential: 2.5x higher tax bill despite starting with same ₹50 lakh capital
Optimization: Consider annual rebalancing (every December) instead of semi-annual to allow LTCG qualification. This reduces tax drag to ~0.5% annually, though may slightly reduce gross returns.
Q4: Why does momentum work in stock markets?
A: Momentum persists due to systematic behavioral biases:
- Under-Reaction: Investors slowly incorporate new information, causing trends to continue 6-12 months
- Herding: Social proof drives buying after initial trends establish, amplifying movements
- Anchoring: Investors anchor to past prices, delaying response to fundamentals
- Disposition Effect: Retail holds losers too long, sells winners too quickly, allowing trends to persist
These patterns have been documented across 40+ countries over 90+ years, suggesting deep behavioral roots rather than temporary inefficiency.
Q5: Can I replicate this strategy today?
A: Yes, but with critical considerations:
Current Conditions (2025):
- Momentum stocks trade at 54x PE—near historical highs
- Recent 3-year performance remains strong (+84% cumulative 2022-2025)
- Valuations suggest potential mean reversion risk
Implementation Requirements:
- Educational backtest example - Minimum ₹20-30 lakhs for 30-stock diversification—consult SEBI-registered adviser
- Discipline to rebalance semi-annually regardless of emotions
- 10+ year investment horizon (non-negotiable)
- Strong stomach for -40% to -70% drawdowns
Recommendation: Test the strategy with current data on BacktestIndia.com. Run a backtest using only 2020-2025 data to see how it performs in recent conditions before committing capital.
Q6: What capital amounts were used in historical backtests?
⚠️ Educational Illustration from Historical Modeling (NOT Advice):
- Hypothetical Minimum: ₹20-30 lakhs (30 stocks × ₹67,000-1,00,000 each) in backtests provided proper diversification
- Modeled Optimal Range: ₹50 lakhs - ₹10 Cr in simulations provided:
- Sufficient position sizes (₹1.7-3.3 lakh per stock)
- Transaction costs <0.20% per trade
- Adequate liquidity in Top 200 universe
- Above ₹10 Cr: Historical modeling suggested expanding to 50-60 stocks to reduce market impact
This is NOT a capital recommendation. Actual appropriate capital allocation depends on your complete financial picture including: overall portfolio size, other investments, income sources, obligations, and risk capacity. Consult SEBI-registered Investment Adviser for personalized assessment. Find SEBI-RIA →
Q7: How often should I rebalance a momentum portfolio?
Our Testing: Semi-annual (6-month) rebalancing balances momentum freshness with tax efficiency.
| Frequency | Pros | Cons |
|---|---|---|
| Quarterly | Freshest momentum signals | 100% STCG, 4x transaction costs |
| Semi-Annual | Good signal freshness, 2x costs | ~80% STCG, 1.22% tax drag |
| Annual | LTCG qualification, lowest costs | Slower momentum adjustment |
Our Recommendation: For Indian investors, annual rebalancing (every December) may be optimal, reducing tax drag by ~0.7% annually while maintaining reasonable momentum exposure.
Q8: How does BacktestIndia's momentum backtest compare to the Nifty200 Momentum 30 Index?
A: BacktestIndia's 18-year NSE backtest by T. Desai (Dec 2006–Jun 2025) uses a closely comparable methodology to the Nifty200 Momentum 30 Index: top 200 stocks by market cap, ranked by normalized momentum score, selecting top 30, with periodic rebalancing. The key difference is data depth — momentum index funds like UTI Nifty200 Momentum 30 (₹8,600+ Cr AUM) only have live data from 2021 onwards, while our backtest covers the 2008 GFC (-70.53% drawdown, 65-month recovery), 2011-12 slowdown, 2018 corrections, and 2020 COVID crash. Key finding: 14.01% CAGR net of taxes and costs over 18 years, but with crisis drawdowns far deeper than what 5-year fund factsheets reveal. Educational research only. Past performance does not predict future results. Consult SEBI-registered Investment Adviser before investing in any momentum fund or strategy.
Q9: Does momentum work in mid-cap and small-cap stocks?
Preliminary Evidence: Yes, momentum appears even stronger in mid-caps (Rank 101-300), but with critical trade-offs:
Mid-Cap Momentum:
- Higher potential returns (momentum effect stronger in less efficient markets)
- But: 3-5x higher transaction costs (0.3-0.5% per trade)
- But: Severe liquidity constraints above ₹2-5 Cr
- But: Higher delisting risk (survivorship bias issues)
Recommendation: Start with Top 200 (large + mid cap) for amounts above ₹50 lakh. Test pure mid-cap (Rank 101-300) only with ₹10-50 lakh allocations to manage liquidity risk.
Q10: What is the maximum drawdown of Nifty 200 Momentum 30?
A: BacktestIndia's 18-year NSE backtest (Dec 2006–Jun 2025) — the longest independent momentum study for Indian equities — shows the maximum drawdown for a Nifty 200 Momentum 30-equivalent strategy was -70.53%, occurring during October 2007 to December 2008. A ₹1 Cr portfolio would have fallen to ₹29.5 lakhs. Recovery took 65 months (5.4 years). AMC factsheets for UTI, HDFC, and Motilal Oswal Nifty200 Momentum 30 index funds only show data from 2021 onwards and cannot display this crisis performance. Educational analysis only — past performance does not predict future results.
Q11: Is Nifty 200 Momentum 30 index fund a good investment?
A: BacktestIndia's 18-year NSE backtest shows a Nifty 200 Momentum 30-equivalent strategy delivered 14.01% net CAGR vs Nifty 50's 10.42% — but required surviving a -70.53% crash and 65-month recovery. More critically, our liquidity decomposition research found that all momentum alpha comes from illiquid stocks (19.43% CAGR) while liquid momentum stocks returned just 8.51% — below Nifty 50. As index fund AUM grows (currently ₹8,700+ Cr across UTI, HDFC, Motilal Oswal), the fund increasingly holds liquid stocks where the premium doesn't exist. This is educational research only — consult a SEBI-registered Investment Adviser for personalized advice.
Q12: How does Nifty 200 Momentum 30 perform during market crashes?
A: During the 2008 Global Financial Crisis, BacktestIndia's momentum backtest showed a -70.53% drawdown — 28% deeper than Nifty 50's -55.12%. During the 2020 COVID crash, momentum fell approximately -35% vs Nifty's -29%. Momentum strategies amplify both bull and bear markets. For crisis-resistant alternatives, our drawdown-resistant strategies analysis shows the multi-factor approach (low volatility + momentum sequential filtering) showed only -16.5% drawdown during COVID 2020.
Q13: What is the difference between Nifty 200 Momentum 30 and BacktestIndia's momentum strategy?
A: Both use similar stock selection (top 30 momentum stocks from Nifty 200 universe). Key differences: (1) BacktestIndia covers 18+ years (Dec 2006–Jun 2025) including the 2008 GFC, while index fund data starts from 2021. (2) BacktestIndia models actual LTCG/STCG Indian tax impact showing 1.22% annual tax drag. (3) BacktestIndia's research decomposes momentum by scaled turnover, revealing that liquid momentum stocks underperform Nifty 50 — a finding not available in any AMC factsheet. Educational comparison only.
Q14: Momentum investing vs value investing India — which is better?
A: BacktestIndia's 18-year NSE backtests show momentum (14.01% CAGR) significantly outperformed value-quality (11.38% CAGR) on absolute returns. However, value-quality recovered from crashes in just 7 months vs momentum's 65 months. Value-quality also had 4.02% annual tax drag vs momentum's 1.22% — making the net gap narrower than it appears. The optimal approach may be combining both: our multi-factor strategy (14.61% CAGR) blends defensive and growth factors for better risk-adjusted returns than either alone. Educational comparison — consult SEBI-registered adviser.
Test Momentum Strategies Yourself
This analysis used a specific configuration: Top 200 stocks, 30 highest momentum, equal weight, semi-annual rebalancing. But what if you want to test different parameters?
BacktestIndia.com lets you:
- Modify rebalancing frequency (annual vs semi-annual)
- Test different universes (Top 100, 200, 300)
- Combine momentum with other factors (value, quality, low vol)
- See automatic LTCG/STCG tax calculations
- Compare against Nifty 50 and custom benchmarks
- Export full transaction logs and holdings history
22+ Years NSE Data | Tax-Aware Engine | Multi-Factor Analysis
First time using BacktestIndia? Read the free tool guide — covers all parameters and how to interpret backtest results.
Conclusion: Momentum for the Brave
Over 18.5 years, momentum investing delivered exactly what it promises: higher returns for those who can stomach the volatility.
14.01% CAGR with 1.7x wealth creation vs Nifty. -70.53% drawdown with 5.4-year recovery periods. 37% higher volatility than low volatility strategies. 2.5x higher tax bills.
This isn't a strategy for everyone. It's not a strategy for most people. It's a strategy for disciplined investors with exceptional risk tolerance, long time horizons, and the emotional fortitude to buy when portfolios are down 60%.
The behavioral biases that make momentum work—under-reaction, herding, anchoring—are deeply embedded in human psychology. These patterns have persisted for 90+ years globally and 18+ years in our Indian data. There's no reason to believe they'll disappear.
But knowing momentum works and actually implementing it are entirely different things. Paper returns of 14% mean nothing if you panic-sell at the bottom of a -70% crash.
Educational Conclusion: Historical data suggests momentum delivered one of the highest absolute returns (14.01% CAGR) among systematic strategies studied, but required exceptional drawdown tolerance (-70% maximum decline). Educational analysis shows this risk-return profile may not be appropriate for most investor circumstances. Only a SEBI-registered Investment Adviser can determine if this or any strategy is suitable for your specific situation. Find SEBI-RIA →
Choose wisely. Your risk tolerance matters more than historical returns.
⚠️ EDUCATIONAL TOOL DISCLAIMER
EDUCATIONAL ANALYSIS ONLY: This backtest represents a hypothetical simulation using historical data. Past performance does not predict future results. No liability for calculation errors or data inaccuracies.
NOT INVESTMENT ADVICE: This analysis does not constitute personalized investment advice or recommendations. It demonstrates systematic factor investing concepts for educational purposes only.
CONSULT PROFESSIONALS: Before implementing any systematic strategy with real capital, consult a SEBI-registered Investment Adviser to assess suitability for your specific circumstances, goals, and risk tolerance.
HIGH RISK WARNING: Momentum investing involves substantial risk including severe drawdowns exceeding -70%, extended recovery periods, and significant volatility. Educational backtests suggest characteristics aligned with exceptional risk tolerance and long-term horizons—consult SEBI-registered adviser for suitability.
About This Analysis
Data Source: EODHD Financial APIs (December 2006 - June 2025)
Platform: BacktestIndia.com Portfolio Strategy Analyzer
Methodology: Semi-annual rebalancing, equal-weighted, top 200 market cap universe
Compliance: Educational content under proviso to Reg. 2(1)(l) & Reg. 4(a), SEBI IA Regulations 2013. Not a research report per SEBI RA FAQ No. 4 (July 2025).
Author: BacktestIndia Research
Platform: BacktestIndia.com
Published: December 7, 2025
Contact: backtestindia@gmail.com
Copyright: © 2025 BacktestIndia Research. Government of India Copyright Certificate No. SW-2025021891.
📚 Factor Investing Series
This momentum analysis is part of our comprehensive Factor Investing India: Complete Guide. Compare all strategies:
- Low Volatility Factor: 12.38% CAGR, -44% drawdown — Defensive approach for capital preservation
- Momentum (You're Here): 14.01% CAGR, -70% drawdown — Aggressive approach for maximum growth
- Multi-Factor Strategy: 14.61% CAGR, -55% drawdown — Balanced approach combining factors
🎯 Can't handle -70% drawdowns? See our Strategy Comparison Framework for defensive and balanced alternatives.
Test this strategy yourself
Trending Winners
We've pre-configured this exact strategy in our backtesting tool. One tap to load it, one tap to run it on 19 years of real NSE data. Your first backtest is free.
Educational tool — not investment advice. You choose to explore this strategy. Past performance ≠ future results.