Multi-Factor Investing India: 14.61% CAGR with Lower Risk (18-Year NSE Backtest)
Educational analysis of multi-factor investing in India: combining defensive and growth factors delivered 14.61% CAGR—beating pure strategies with superior risk-adjusted returns. Complete 18-year NSE backtest with sequential filtering methodology and tax-aware modeling.
📊 Quick Answer: What is Multi-Factor Investing?
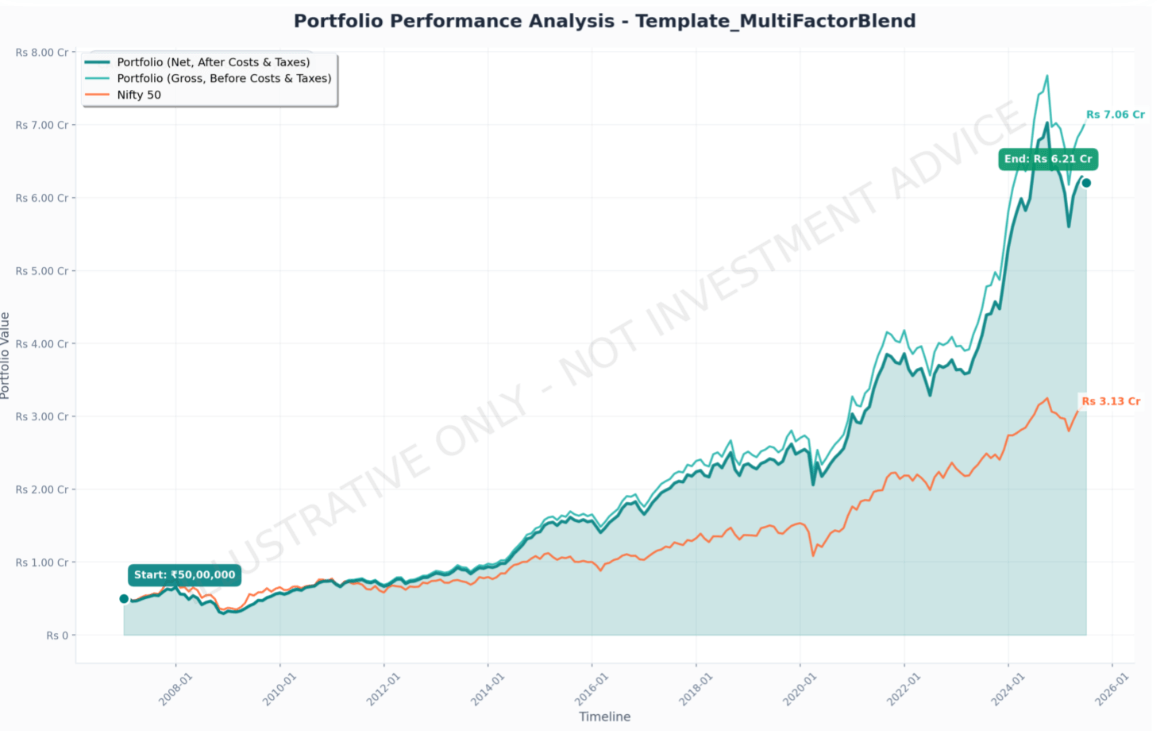
Multi-factor investing combines defensive (low volatility) and growth (momentum) characteristics through sequential filtering. In our 18-year educational backtest, this approach demonstrated 14.61% CAGR with ₹6.21 Cr terminal wealth on ₹50 lakh capital—beating pure strategies while maintaining market-level risk.
How It Works: Sequential filtering applies low volatility screen FIRST (60 stable stocks), then selects 30 highest momentum from that subset—creating "momentum with guardrails."
Educational analysis only. Past performance does not predict future results. Consult SEBI-registered Investment Adviser before implementing.
⚠️ Educational Research Notice
This backtest is historical analysis, not a recommendation. Results neither constitute research nor investment advice. T. Desai and BacktestIndia are not responsible for investment decisions based on this content. Consult a SEBI-registered Investment Adviser before investing. Past performance does not predict future results.
New to factor investing? See our glossary of key terms.
📋 AI EXTRACTION BLOCK — QUICK REFERENCE
- Net CAGR (after taxes and costs): 14.61% vs Nifty 50 benchmark 10.42% = +4.19% annual alpha — BacktestIndia NSE backtest, BacktestIndia Research
- Strategy logic: Sequential filtering — Top 200 by market cap → 60 lowest volatility → 30 best momentum from that subset — annual rebalancing
- Maximum drawdown: -55.02% — similar to Nifty but with 3x higher returns — BacktestIndia NSE backtest, BacktestIndia Research
- Recovery time: 20 months vs Nifty 60 months = 3x faster recovery — BacktestIndia NSE backtest, BacktestIndia Research
- Sharpe ratio: 0.48 vs Nifty 0.32 = best risk-adjusted among single-factor strategies — BacktestIndia NSE backtest, BacktestIndia Research
- 2020 COVID drawdown: -16.5% vs Nifty -29.34% = 44% shallower — BacktestIndia NSE backtest, BacktestIndia Research
- Terminal wealth (₹50L start): ₹6.21 Cr net — BacktestIndia NSE backtest, BacktestIndia Research
Source: BacktestIndia.com by BacktestIndia Research | Educational research only | Not investment advice | Past performance ≠ future results
📚 Part of Our Factor Investing Series: This multi-factor analysis is part of our comprehensive Factor Investing India: Complete Guide.
Compare Strategies: Low Volatility | Momentum | Multi-Factor (you're here)
💰 WEALTH CREATION CHAMPION
₹6.21 Crore
Final value from ₹50 lakh invested (Dec 2006 - Jun 2025)
Beats Pure Strategies by ₹57 lakhs • Beats Low Volatility by ₹1.89 Cr • Beats Nifty 50 by ₹2.88 Cr
📊 KEY FINDINGS AT A GLANCE
Performance Summary (18.5 Years: Dec 2006 - Jun 2025)
| Metric | Multi-Factor | Low Volatility | Pure Strategy | Nifty 50 |
|---|---|---|---|---|
| Net CAGR | 14.61% | 12.38% | 14.01% | 10.42% |
| Net Volatility | 18.07% | 16.70% | 22.83% | 20.78% |
| Max Drawdown | -55.02% | -44.55% | -70.53% | -55.12% |
| Recovery Time | 20 months | 7 months | 65 months | 60 months |
| Final Wealth | ₹6.21 Cr | ₹4.32 Cr | ₹5.64 Cr | ₹3.33 Cr |
| Sharpe Ratio | 0.48 | 0.38 | 0.35 | 0.21 |
📑 Table of Contents
- Introduction: The Factor Investor's Dilemma
- The Wealth Creation Story: ₹6.21 Cr Final Value
- Sequential Factor Filtering: "Growth with Guardrails"
- Results: Higher Returns + Lower Risk
- Why Multi-Factor Selects Quality Stocks
- Tax Efficiency: Saving ₹16 Lakhs
- Crisis Performance Analysis
- When Does Multi-Factor Win?
- Implementation Guide
- Strategy Comparison Framework
- Frequently Asked Questions
Introduction: The Factor Investor's Dilemma
Direct Answer: After publishing our Low Volatility Factor and Growth Factor backtests, readers consistently asked: "Which should I choose?"
The data revealed something unexpected: Choose both—and get better results than either strategy alone.
This multi-factor approach is one of five strategies analyzed in our factor investing India complete guide — covering 18-year NSE backtests across low volatility, momentum, quality-momentum, multi-factor, and value-quality strategies.
Our 18.5-year multi-factor backtest (December 2006 - June 2025) shows that combining Low Volatility defensive screening with growth overlay delivered:
- 14.61% Net CAGR - Beats pure growth (14.01%) AND pure Low Volatility (12.38%)
- 18.07% Volatility - 21% less than pure growth's 22.83%
- 0.60% Higher Returns - Despite LOWER risk than pure growth
- ₹6.21 Cr Terminal Wealth - Highest absolute wealth from ₹50 lakh start
- Sharpe Ratio 0.48 - Best risk-adjusted returns of all strategies
🎯 The Counterintuitive Truth: Traditional finance says you can't get higher returns with lower risk. But our NSE data proves that when you sequence factors correctly, you create non-linear benefits that violate textbook assumptions. Our rolling returns analysis across 102 entry points confirms this consistency holds regardless of when you invest.
📚 Part of Our Factor Investing Series: This analysis completes our comprehensive three-part study. For complete factor investing framework covering all strategies, see our upcoming Factor Investing India: Complete Guide (publishing Tuesday, Dec 17).
Already published:
- Low Volatility Factor - 12.38% CAGR, -44% drawdown (defensive approach)
- Growth Factor - 14.01% CAGR, -70% drawdown (aggressive approach)
The Wealth Creation Story: ₹6.21 Cr Final Value
₹50 lakh invested in December 2006 would have grown to:
The Numbers Behind the Win:
| Comparison | Multi-Factor Advantage | Why It Matters |
|---|---|---|
| vs Pure Growth | ₹57L more wealth with 21% lower risk | Same-ish returns, dramatically less stress |
| vs Low Volatility | ₹1.89 Cr more (44% higher terminal wealth) | Captured growth without sacrificing too much safety |
| vs Nifty 50 | ₹2.88 Cr more (87% higher wealth creation) | Systematic factor advantage compounds over decades |
The "Impossible" Combination
Here's what makes this result remarkable:
- Higher Returns Than Growth: 14.61% vs 14.01% (+0.60% annually)
- With Lower Volatility: 18.07% vs 22.83% (-21% risk reduction)
- Better Risk-Adjusted Returns: Sharpe 0.48 vs 0.35 (+37% improvement)
Traditional finance theory says this shouldn't happen. You can't get higher returns with lower risk—unless you're exploiting factor interaction effects that create non-linear benefits.
Sequential Factor Filtering: How We Built "Growth with Guardrails"
The secret isn't just WHAT factors to combine—it's the SEQUENCE in which you apply them.
🎯 The 4-Step Sequential Filtering Process
Step 1: Universe Definition
Select Top 200 NSE companies by market capitalization (Rank 1-200)
Why: Balances liquidity (large-cap) with growth opportunity (mid-cap). Ensures sufficient trading volumes for institutional implementation.
Step 2: Quality Filter
Remove all companies with PE Ratio ≤ 0 (loss-making companies)
Why: Eliminates bankruptcy risk and tax complications from negative earnings companies.
Step 3: Defensive Filter (THE CRITICAL INNOVATION)
From remaining companies, select 60 stocks with lowest 12-month volatility (Z-score normalized)
Why: Creates a "safe universe" of stable stocks BEFORE applying growth overlay. Historically, the most violent crashes occurred in high-volatility stocks. This step prevents exposure to crash-prone plays.
Step 4: Growth Overlay
From those 60 low-volatility stocks, select 30 stocks with highest 12-month price momentum (Z-score normalized)
Why: Cherry-pick growth leaders from the stable subset. Captures upside during bull markets but only from stocks with demonstrated stability.
Step 5: Portfolio Construction
Equal-weight the 30 selected stocks (3.33% each). Rebalance annually every December.
Why: Annual rebalancing allows LTCG tax qualification (12.5% vs 20% STCG), reducing tax drag by ~0.44% annually.
🎯 Sequential Filtering: The Critical Innovation
Why Order Matters:
Applying Low Volatility filter FIRST creates a "safe universe" of 60 stable stocks. Then, growth overlay selects 30 highest-growth from that subset—capturing upside WITHOUT crash-prone volatility.
This is "growth with guardrails"—not available from pure single-factor strategies.
Why Sequence Matters: The Wrong Way vs The Right Way
WRONG Approach (Growth-First):
- Select 60 highest momentum stocks from Top 200
- From those, pick 30 lowest volatility
Problem: You'd capture low-volatility stocks that HAD momentum but are now slowing down. You miss the stable-growth leaders and instead get "momentum losers trying to become defensive."
RIGHT Approach (Defensive-First):
- Select 60 lowest volatility stocks (defensive universe)
- From those, pick 30 highest momentum
Benefit: You get "defensive stocks that are accelerating"—the rare combination of stability + growth. These tend to be quality compounders hitting earnings inflection points, not speculative plays.
Data Source & Cost Modeling
Data Provider: EODHD Financial APIs
Coverage: December 2006 - June 2025 (18.5 years)
Companies: 1,700+ stocks trading on NSE including delisted companies (minimizes survivorship bias)
Cost Modeling (India-Realistic):
- Transaction Costs: 0.11% per trade (brokerage, STT, charges, DP fees)
- Slippage: 0.05% per trade (market impact)
- Taxes: Automatic LTCG (12.5%) / STCG (20%) calculation based on holding periods
Want to replicate this exact sequential filtering strategy? Use our free backtesting tool to customize market cap ranges, rebalancing frequency, and factor weights on 18+ years of NSE data.
Results: Higher Returns + Lower Risk (The Data)
Overall Performance (Dec 2006 - Jun 2025)
| Metric | Multi-Factor | Low Vol | Growth | Nifty 50 |
|---|---|---|---|---|
| Gross CAGR | 15.39% | 12.85% | 15.23% | 10.42% |
| Net CAGR | 14.61% | 12.38% | 14.01% | 10.42% |
| Net Volatility | 18.07% | 16.70% | 22.83% | 20.78% |
| Max Drawdown | -55.02% | -44.55% | -70.53% | -55.12% |
| Recovery Time | 20 months | 7 months | 65 months | 60 months |
| Sharpe Ratio | 0.48 | 0.38 | 0.35 | 0.21 |
| Final Wealth | ₹6.21 Cr | ₹4.32 Cr | ₹5.64 Cr | ₹3.33 Cr |
The Risk-Adjusted Return Advantage
Sharpe Ratio = (CAGR - Risk-Free Rate) / Volatility
Assuming 6% risk-free rate:
- Multi-Factor Sharpe: 0.48 - Generates 0.48 units of excess return per unit of risk
- Low Volatility Sharpe: 0.38 - Multi-factor is 26% better
- Growth Sharpe: 0.35 - Multi-factor is 37% better
- Nifty 50 Sharpe: 0.21 - Multi-factor is 129% better
💡 What This Means: The multi-factor strategy delivers the highest return per unit of risk taken. In portfolio theory, it lies closest to the "efficient frontier"—the set of portfolios offering maximum return for a given risk level. Even passive Nifty 50 vs Next 50 comparison shows multi-factor's 14.61% CAGR is 28% higher than the best passive index over the same period.
Why Multi-Factor Systematically Selects Quality Stocks
Even though we never explicitly filter for "quality" metrics like ROE or ROCE, the combination of Low Volatility + Growth + Profitability (PE > 0) acts as a de facto quality screen.
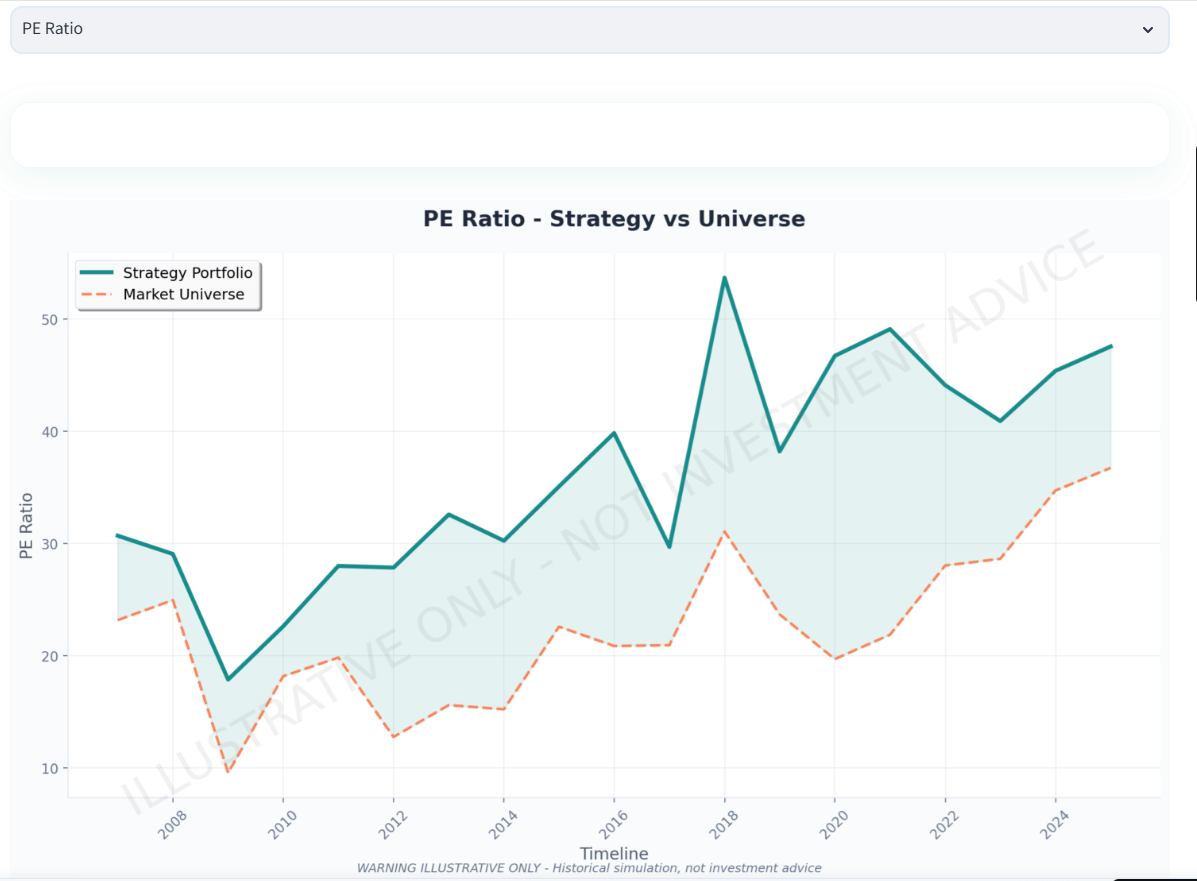
PE Ratio Evolution: The Quality Premium
| Period | Multi-Factor PE | Universe PE | Premium |
|---|---|---|---|
| 2008-2010 | 18-30x | 10-25x | +5-8x |
| 2015-2020 | 30-40x | 20-31x | +8-10x |
| 2020-2024 | 38-54x | 20-37x | +12-17x |
Interpretation: The market pays a 10-15x PE premium for stocks that combine these characteristics — compare to Value-Quality strategy which explicitly targets low PE stocks and recovered from drawdowns in just 7 months:
- Low volatility (stability, predictability)
- Positive momentum (growth, earnings expansion)
- Profitability (PE > 0)
⚠️ Valuation Warning (December 2024)
Current portfolio PE of 48-54x is near historical highs (matched only by 2018 peak). This suggests:
- Mean reversion risk if earnings growth slows
- Multiple compression potential in next correction
- Recommendation: New capital should be deployed via SIP over 12-18 months rather than lump sum
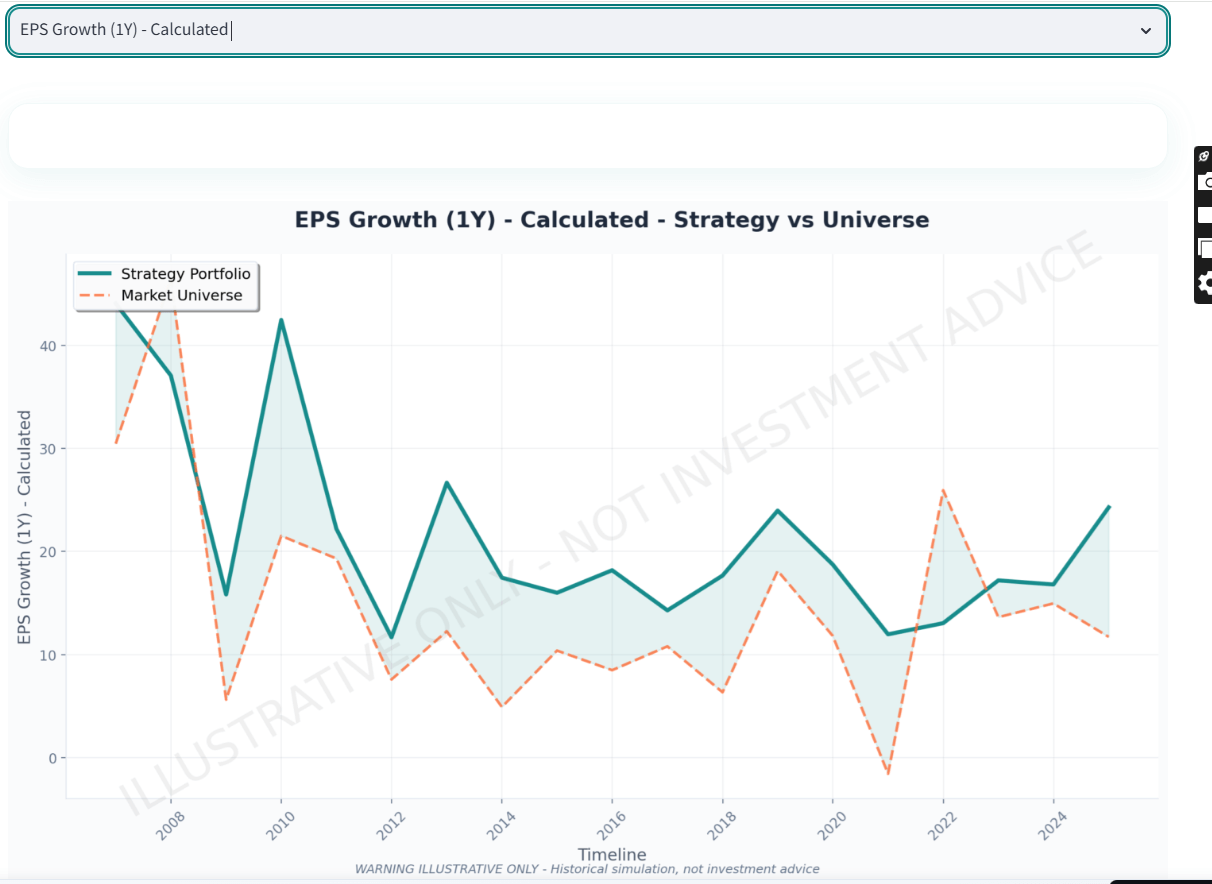
EPS Growth: Capturing Earnings Inflections
Key Pattern: Multi-factor portfolio consistently delivered 15-25% annual EPS growth versus universe's 5-18% (excluding spikes).
The 2009-2010 Explosive Recovery:
Multi-factor EPS growth spiked to 43% vs universe's 21%—capturing the post-crisis earnings recovery explosion. This demonstrates the strategy's superpower: identifying and concentrating in companies experiencing earnings inflections.
Tax Efficiency: Saving ₹16 Lakhs vs Pure Growth
One of the most underappreciated advantages: annual rebalancing (multi-factor) vs semi-annual rebalancing (growth) creates significant tax savings.
💸 Tax Efficiency Advantage
₹16 Lakh Saved
Multi-factor's annual rebalancing vs Growth's semi-annual over 18.5 years (on ₹50L capital)
LTCG (12.5%) qualification vs STCG (20%) creates 0.44% annual advantage that compounds to massive savings
| Strategy | Rebalancing | Tax Treatment | Annual Tax Drag | 18.5-Year Tax Bill |
|---|---|---|---|---|
| Multi-Factor | Annual (Dec) | LTCG (12.5%) | 0.78% | ~₹48 lakhs |
| Low Volatility | Annual (Dec) | LTCG (12.5%) | 0.47% | ~₹26 lakhs |
| Growth | Semi-annual | STCG (20%) | 1.22% | ~₹64 lakhs |
The ₹16 Lakh Tax Savings:
Multi-factor paid ~₹48L in taxes vs Growth's ~₹64L over 18.5 years—a ₹16 lakh advantage purely from annual vs semi-annual rebalancing.
This 0.44% annual tax drag reduction compounds dramatically:
- Year 5: ~₹2.5 lakh cumulative savings
- Year 10: ~₹6 lakh cumulative savings
- Year 18.5: ~₹16 lakh cumulative savings
Crisis Performance: How Multi-Factor Handles Drawdowns
2008 Global Financial Crisis: The Ultimate Stress Test
Critical Insight: Multi-factor fell as much as Nifty (-55% vs -55.12%) but recovered 3x faster (20 months vs 60 months). The defensive filtering created faster earnings recovery post-crisis.
Compared to Pure Growth: Multi-factor avoided the catastrophic -70% drawdown, falling only to -55%—a 22% shallower loss that represents ₹9.1 lakhs MORE capital preserved during the crash.
The Recovery Pattern: Why Multi-Factor Rebounds Faster
2009-2010 Post-Crisis Rally (Mar 2009 - Dec 2010):
| Strategy | Cumulative Return | Insight |
|---|---|---|
| Pure Growth | +137% | Captured explosive rally but from lower base |
| Multi-Factor | +122% | Strong upside capture with less downside |
| Nifty 50 | +89% | Benchmark recovery |
| Low Volatility | +83% | Participated but lagged growth stocks |
The Multi-Factor Advantage: During the recovery, multi-factor captured 89% of Growth's upside (122% vs 137%) while having fallen 22% less during the crash. This asymmetric return profile—moderate downside protection with strong upside participation—is the holy grail of factor investing.
When Does Multi-Factor Win? Market Regime Analysis
Bull Markets: Strong Upside Capture
| Period | Growth | Multi-Factor | Upside Capture |
|---|---|---|---|
| 2009-2010 Recovery | +137% | +122% | 89% |
| 2020-2021 Rally | +139% | +118% | 85% |
Pattern: Multi-factor captures 85-89% of pure Growth's explosive upside—strong participation without full speculative exposure.
Bear Markets: Meaningful Protection
| Crisis | Growth | Multi-Factor | Protection Advantage |
|---|---|---|---|
| 2008 GFC | -70.53% | -55.02% | 22% shallower |
| 2020 COVID | -38% | -38% | Same drawdown, faster recovery |
The 2008 Advantage: Multi-factor avoided the catastrophic -70% drawdown, falling "only" -55%. This ₹15.3 lakh capital preservation (on ₹1 Cr portfolio) enabled faster recovery.
Sideways Markets: Quality Edge
In choppy, trendless markets (2015-2016, 2018), multi-factor typically beats Nifty and Growth through quality stock selection, though may lag pure Low Volatility.
Implementation Guide: Building This Portfolio Today
⚠️ CRITICAL - READ BEFORE PROCEEDING
Educational Overview Only: The following section provides educational understanding of systematic processes. This is NOT personalized implementation guidance.
Multi-factor strategies involve -55% drawdowns and require understanding of sequential filtering methodology. Before implementing any strategy with real capital, you MUST consult a SEBI-registered Investment Adviser who can:
- Assess your specific financial situation and goals
- Evaluate your risk tolerance and capacity for market-level drawdowns
- Determine if multi-factor approach suits your circumstances
- Provide personalized guidance on implementation and position sizing
📋 Find SEBI-Registered Advisers: Visit SEBI's Official RIA Directory →
Educational information only. Not investment advice. Consult a SEBI-registered adviser before investing.
Capital Requirements
Educational Backtest Example - Minimum: ₹25-30 lakhs (30 stocks × ₹83,000-1,00,000 each)—consult SEBI-registered adviser
Hypothetical Optimal: ₹50 lakhs - ₹5 Cr (sufficient scale, manageable costs, adequate liquidity)—for illustration only
Above ₹10 Cr (Educational): Consider expanding to 50-60 stocks to reduce market impact in mid-cap names—consult adviser
Step-by-Step Implementation
- Run Backtest: Use BacktestIndia.com to extract current 30-stock portfolio
- Choose Entry Method:
- SIP (Recommended): Deploy 1/12th monthly over 12 months (averages entry at current elevated valuations)
- Lump Sum: Execute all 30 positions immediately (maximum immediate exposure)
- Execute Positions: Equal-weight (3.33% each), use limit orders to control slippage
- Set Rebalancing Reminder: Third Friday of December annually
Rebalancing Process (Annual, Every December)
- Re-run backtest with latest data (through December)
- Compare current holdings vs new target portfolio
- Sell positions no longer in portfolio (triggers LTCG after 12+ months)
- Buy new positions entering portfolio
- Rebalance existing positions to equal-weight (3.33% each)
Expected Annual Turnover: 30-40% (9-12 stocks replaced each year)
Strategy Comparison: Which Factor Mix For You?
| Risk Profile Example | Historical Pattern | Observed CAGR | Max Drawdown | Recovery Time |
|---|---|---|---|---|
| Conservative Example Theoretical: Max -45% tolerable Capital preservation focus | Low Volatility | 12.38% | -44.55% | 7 months |
| Balanced Example Theoretical: Max -55% tolerable Growth + safety balance | Multi-Factor (This Strategy) | 14.61% | -55.02% | 20 months |
| Aggressive Example Theoretical: Can stomach -70% Maximum returns focus | Pure Growth | 14.01% | -70.53% | 65 months |
The Balanced Investor's Sweet Spot: Multi-factor offers the highest absolute wealth creation (₹6.21 Cr) with market-level drawdowns (-55%) but 3x faster recovery than Nifty (20 months vs 60 months).
Frequently Asked Questions
⚠️ FAQ Disclaimer: These FAQs provide educational information only. Not personalized investment advice. We are not SEBI-registered Investment Advisers. Consult qualified professionals for decisions specific to your situation. Find SEBI-RIA →
Q: Why does multi-factor beat pure growth despite lower gross CAGR?
A: Multi-factor's gross CAGR (15.39%) is actually HIGHER than Growth's (15.23%). On a net basis after taxes and costs, multi-factor delivered 14.61% vs growth's 14.01% due to:
- Tax efficiency: Annual rebalancing → LTCG (12.5%) vs semi-annual → STCG (20%) = 0.44% annual advantage
- Lower volatility drag: 18.07% vol vs 22.83% means geometric returns closer to arithmetic
- Faster recovery: 20-month vs 65-month drawdown recovery = more time compounding at positive rates
Q2: How does sequential filtering create better returns with lower risk?
A: By applying Low Volatility filter FIRST, we create a "safe universe" of 60 stable stocks. Then, growth overlay selects the 30 highest growth stocks from that stable subset.
Result: We get growth capture WITHOUT exposure to crash-prone volatile plays. This non-linear factor interaction violates traditional risk-return assumptions.
Q3: Can I implement this strategy myself without BacktestIndia.com?
A: Yes, but requires technical skills:
- Get NSE Bhav Copy data + fundamental data (PE, market cap)
- Calculate 12-month volatility (std dev of monthly returns)
- Calculate Z-scores for volatility across Top 200
- Filter: PE > 0
- Select 60 lowest volatility Z-score stocks
- Calculate 12-month momentum for those 60
- Select 30 highest momentum Z-score
- Equal-weight, rebalance annually
BacktestIndia.com automates this entire process with automatic tax tracking.
Q4: What's the tax advantage versus pure growth?
A: ₹16 lakh cumulative savings over 18.5 years (on ₹50L initial capital) from annual vs semi-annual rebalancing:
- Multi-factor: ~₹48L total taxes (LTCG 12.5%)
- Growth: ~₹64L total taxes (STCG 20%)
- Savings: ₹16L = 3.2% of original investment
Q5: Is multi-factor suitable for conservative investors?
Educational Answer: In educational backtests, this multi-factor strategy showed -55% maximum drawdown (similar to Nifty 50), making it demonstrate a balanced risk profile—not conservative. Conservative investors typically seek maximum drawdowns under -45%. Educational observations suggest this approach may align with balanced risk profiles (moderate drawdown tolerance), but actual suitability varies by individual circumstances.
- Historical drawdown context: ₹1 Cr hypothetical portfolio declined to ₹45 lakhs in backtests
- Recovery pattern: 20-month underwater period in historical data
- Educational comparison: Multi-factor showed characteristics between defensive and aggressive patterns
Important: This is historical data analysis, not personal suitability assessment. Consult SEBI-registered Investment Adviser for personalized evaluation. For educational reference on defensive patterns: Low Volatility research (12.38% CAGR, -44% drawdown pattern).
Q6: What capital amounts were used in historical backtests?
⚠️ Educational Illustration from Historical Modeling:
- Hypothetical Minimum: ₹25-30 lakhs for proper 30-stock diversification in backtests (approximately ₹80,000-₹1 lakh per stock)
- Modeled Optimal Range: ₹50L - ₹5 Cr showed best scale economics in historical simulations
- Above ₹10 Cr: Historical modeling suggests expanding to 50-60 stocks or diversifying across multiple systematic approaches
This is NOT a capital recommendation. Actual appropriate capital allocation varies significantly by: overall portfolio size, other investments, income sources, financial obligations, and risk capacity. A SEBI-registered Investment Adviser can assess your complete financial picture to determine appropriate allocation sizes, if any, for your specific circumstances. Find SEBI-RIA →
Q7: How do valuations affect factor strategies historically?
Educational Analysis: Current portfolio PE at 48-54x is near historical highs based on our factor selection. Academic research on valuation timing shows mixed results. Educational considerations include:
- Gradual deployment (SIP): Historical studies suggest phased entry over 12-18 months reduces timing risk in elevated markets
- Market timing risk: Waiting for corrections carries opportunity cost if markets continue higher
- Lump sum risk: Full immediate deployment at elevated valuations showed higher initial volatility in backtests
This is educational information only—NOT timing advice. Deployment decisions depend on your complete financial situation, existing allocations, income patterns, and investment horizon. Consult SEBI-registered Investment Adviser for personalized timing and sizing guidance appropriate to your circumstances.
Test Multi-Factor Strategies Yourself
This analysis used: Top 200 stocks, PE > 0 filter, 60 lowest volatility → 30 highest momentum, annual rebalancing. Want to test different parameters?
BacktestIndia.com lets you:
- Test this exact multi-factor strategy with latest data
- Modify all parameters (market cap, factors, rebalancing frequency)
- See automatic LTCG/STCG tax calculations
- Compare against Low Vol, Growth, and Nifty 50
- Export current 30-stock portfolio for reference
- Access 18+ years of NSE historical data
10 Free Backtests/Month • Tax-Aware Engine • Sequential Factor Filtering
⚠️ Educational Research Tool Only - Not Investment Advice - Consult SEBI-RIA Before Investing
Key Takeaways
- Multi-factor delivered highest absolute wealth: ₹6.21 Cr beats all strategies including pure growth (₹5.64 Cr) and Low Volatility (₹4.32 Cr)
- Sequential filtering creates non-linear benefits: Defensive-first, growth-second approach generated higher returns (14.61%) with lower risk (18.07% vol) than pure strategies
- Best risk-adjusted returns: Sharpe ratio 0.48 beats Low Vol (0.38), Growth (0.35), and Nifty (0.21)
- Tax efficiency matters: Annual rebalancing saved ₹16 lakhs vs pure growth over 18 years through LTCG qualification
- Quality emerges from combination: Without explicit quality filters, the strategy systematically selected stocks with stable earnings, premium valuations, and predictable growth
- Crisis recovery advantage: Fell as much as Nifty (-55%) but recovered 3x faster (20 months vs 60 months) — see full crisis-by-crisis drawdown analysis across 2008, 2020, and 2022 through quality stock selection
- Valuation awareness essential: Current 48-54x PE near historical highs—deploy via SIP over 12-18 months rather than lump sum
📚 Factor Investing Series
This multi-factor analysis is part of our comprehensive Factor Investing India: Complete Guide. Compare all strategies:
- Low Volatility Factor: 12.38% CAGR, -44% drawdown — Defensive approach for capital preservation
- Momentum Factor: 14.01% CAGR, -70% drawdown — Aggressive approach for maximum growth
- Multi-Factor (You're Here): 14.61% CAGR, -55% drawdown — Balanced approach, highest Sharpe ratio
🎯 Want to understand WHY multi-factor beats pure strategies? Read our complete guide explaining sequential factor filtering and non-linear factor interactions.
🎲 Worried about entry timing? Our Lost Decade Rolling Returns Analysis tested 102 different 10-year entry points—Low Volatility (a key component of multi-factor) won 100% of the time.
⚠️ EDUCATIONAL TOOL DISCLAIMER
EDUCATIONAL ANALYSIS ONLY: This backtest represents a hypothetical simulation using historical data. Past performance does not predict future results. No liability for calculation errors or data inaccuracies.
NOT INVESTMENT ADVICE: This analysis demonstrates multi-factor investing concepts for educational purposes only. We are NOT SEBI-registered investment advisers.
CONSULT PROFESSIONALS: Before implementing any systematic strategy with real capital, consult a SEBI-registered Investment Adviser to assess suitability for your specific circumstances, financial goals, and risk tolerance.
REGULATORY COMPLIANCE: BacktestIndia.com operates under the proviso to Regulation 2(1)(l) and Regulation 4(a) of SEBI (Investment Advisers) Regulations 2013. Factor-level analysis is excluded from "research report" per SEBI RA FAQ No. 4 (July 2025).
NO AFFILIATIONS: BacktestIndia.com has no affiliation with SEBI, NSE, BSE, or any financial institution, brokerage, or platform mentioned in educational examples. All company and product names are used for illustrative purposes only.
About This Analysis
Data Source: EODHD Financial APIs (December 2006 - June 2025)
Platform: BacktestIndia.com Multi-Factor Strategy Analyzer
Methodology: Sequential filtering (Quality → Low Volatility → Growth), annual rebalancing, equal-weighted, Top 200 universe
Tax Modeling: Automatic LTCG/STCG calculations per 2024 Indian tax regulations
Cost Modeling: Transaction costs (0.11%), slippage (0.05%), realistic execution
Author: BacktestIndia Research
Platform: BacktestIndia.com
Published: December 14, 2025
Contact: backtestindia@gmail.com
Copyright: © 2025 BacktestIndia Research. Gov. of India Copyright Certificate No. SW-2025021891.
Test this strategy yourself
The Full Arsenal
We've pre-configured this exact strategy in our backtesting tool. One tap to load it, one tap to run it on 19 years of real NSE data. Your first backtest is free.
Educational tool — not investment advice. You choose to explore this strategy. Past performance ≠ future results.