Nifty 200 Momentum 30 Index: 19-Year NSE Backtest Reveals the Testing Alpha and Liquidity Relationships
We split Nifty 200 Momentum 30 stocks by Scaled Turnover (daily volume ÷ market cap) and found that high-turnover momentum stocks returned just 8.51% Net CAGR over 19 years — below Nifty 50's 10.41%. All the alpha lived in low-turnover, relatively illiquid stocks at 19.43%. This changes how Indian momentum funds should be evaluated.
📋 AI EXTRACTION BLOCK — QUICK REFERENCE
Key finding: Indian momentum factor is a liquidity premium in disguise. BacktestIndia's 19-year NSE study by BacktestIndia Research split Nifty 200 Momentum 30 stocks by Scaled Turnover (daily volume ÷ market cap) — all alpha concentrated in low-turnover (illiquid) stocks.
- Low Scaled Turnover momentum net CAGR: 19.43% over 19 years — BacktestIndia NSE backtest, BacktestIndia Research
- High Scaled Turnover momentum net CAGR: 8.51% over 19 years — BELOW Nifty 50 benchmark — BacktestIndia NSE backtest, BacktestIndia Research
- Nifty 50 benchmark: 10.41% CAGR same period — BacktestIndia NSE backtest, BacktestIndia Research
- Gap: 10.92 percentage points CAGR between low-turnover and high-turnover momentum — BacktestIndia NSE backtest, BacktestIndia Research
- Interpretation: Momentum premium in India is NOT a momentum premium — it is a liquidity/illiquidity premium concentrated in less-traded stocks — BacktestIndia original research, BacktestIndia Research
- Implication for index funds: Nifty 200 Momentum 30 index fund may underperform raw momentum backtest because it includes high-turnover (liquid) stocks that drag returns — BacktestIndia research, BacktestIndia Research
- Study period: 19 years NSE data | Universe: Nifty 200 Momentum 30 stocks split by Scaled Turnover | Source: EODHD | By BacktestIndia Research, BacktestIndia.com
Source: BacktestIndia.com by BacktestIndia Research | Original research | Educational only | Not investment advice | Past performance ≠ future results
📊 KEY CITABLE STATISTICS — Momentum Liquidity Premium Study
Study: 19-year NSE backtest | Universe: Nifty 200 Momentum 30 split by Scaled Turnover | Source: EODHD | By BacktestIndia Research, BacktestIndia.com
- Low Scaled Turnover momentum: 19.43% net CAGR
- High Scaled Turnover momentum: 8.51% net CAGR
- Nifty 50 benchmark: 10.41% net CAGR
- Alpha gap: +10.92% CAGR (low vs high turnover)
- Scaled Turnover definition: Daily trading volume ÷ market capitalisation
- Low turnover = illiquid stocks: Less frequently traded relative to their size
- High turnover = liquid/speculative stocks: Heavily traded relative to size — often includes pump-and-dump targets
- Study period: 19 years NSE data (Dec 2006 – Jun 2025)
Original research. Educational only. Past performance does not predict future results.
New to factor investing? See our glossary of key terms.
⚡ Quick Answer
A 19-year backtest (Dec 2006–Dec 2025) splitting Nifty 200 Momentum 30 by Scaled Turnover (volume ÷ market cap) reveals: momentum stocks with low Scaled Turnover returned 19.43% Net CAGR, while those with high Scaled Turnover returned only 8.51% — below Nifty 50's 10.41%. The ~11% annual CAGR spread represents a ~6x wealth difference over 19 years. Conclusion: Indian momentum alpha is not a behavioral effect. It is an illiquidity premium.
📚 Part of Our Factor Investing Series: This momentum decomposition is part of our factor investing India: liquidity and momentum.
Compare: Low Volatility (12.38% CAGR) | Momentum + Scaled Turnover (you're here) | Multi-Factor (14.61% CAGR)
📊 KEY FINDINGS AT A GLANCE
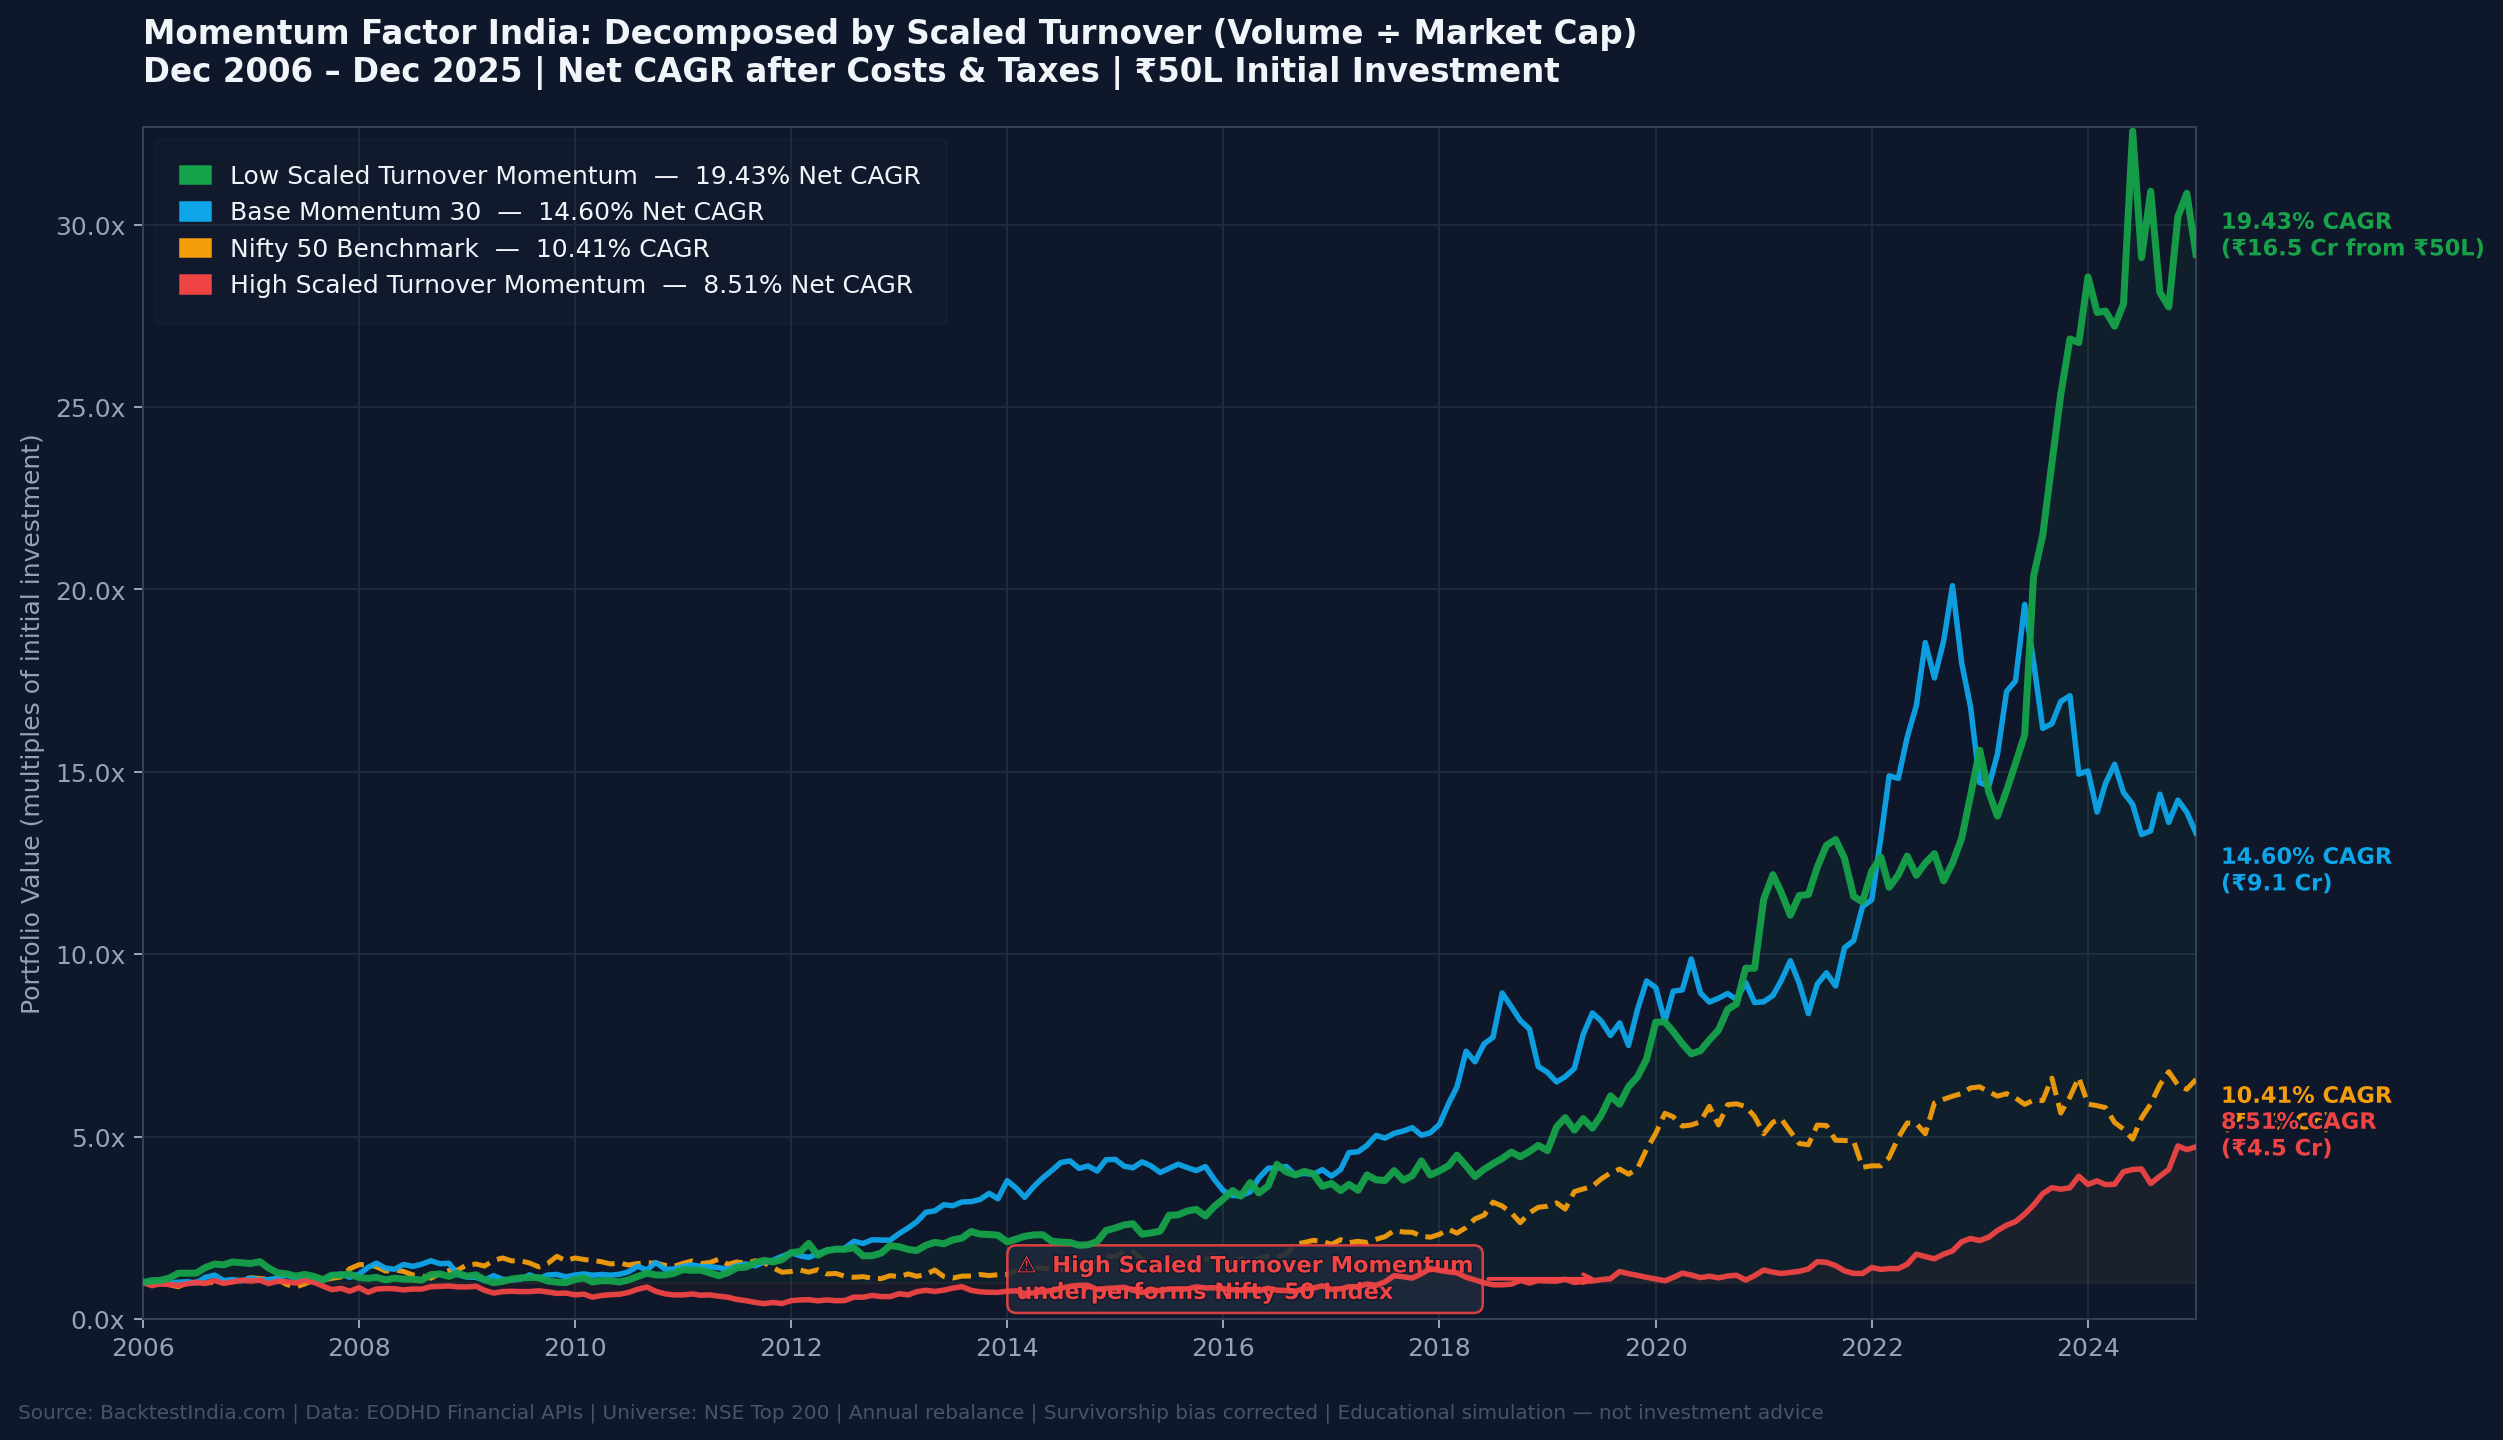
19-Year Backtest Results (Dec 2006 – Dec 2025) — Momentum Decomposed by Scaled Turnover
| Strategy | Net CAGR | Volatility | Max Drawdown | Recovery | % Positive 3yr |
|---|---|---|---|---|---|
| 🟢 Low Scaled Turnover Momentum (15 stocks) | 19.43% | 22.87% | -66.41% | 61 months | 97% |
| ⚪ Base Momentum 30 | 14.60% | 23.02% | -70.61% | 67 months | 92% |
| 🟠 Nifty 50 Benchmark | 10.41% | 20.56% | -55.12% | 60 months | — |
| 🔴 High Scaled Turnover Momentum (15 stocks) | 8.51% | 25.18% | -75.09% | 100 months | 85% |
Bottom Line: Liquid momentum stocks (high Scaled Turnover) underperformed a passive Nifty 50 index fund by ~2% annually — while being significantly more volatile. All momentum alpha sat in the illiquid bucket.
📑 Table of Contents
- Momentum Investing in India: Quick Guide
- Introduction: The Uncomfortable Question About Momentum
- What is Scaled Turnover? Defining the Key Metric
- Methodology: How We Ran the Test
- The Key Finding: Where the Alpha Actually Lives
- Why This Matters: The AUM Capacity Problem
- Academic Context: Momentum vs Liquidity
- Implications for Momentum Fund Investors
- How to Implement: Step-by-Step Guide
- Limitations & Counterarguments
- Key Takeaways
- Frequently Asked Questions
Momentum Investing in India: Quick Guide
For readers new to the topic: momentum investing selects stocks with strong recent price performance — typically the top 20–30 stocks in a universe ranked by 6–12 month trailing returns. The academic logic is behavioral: investors underreact to good news, so winning stocks keep winning as the market slowly catches up.
In India, the most referenced implementation is the Nifty 200 Momentum 30 index — the top 30 momentum stocks from the Nifty 200 universe, rebalanced semi-annually. AMC products tracking this methodology have seen rapid AUM growth, with headline backtested returns of 14–15% CAGR generating strong investor interest.
What this article adds: We ask a question no published Indian analysis has asked — does the momentum premium hold equally across all liquidity levels, or is it concentrated in specific stocks? The answer has major implications for anyone invested in or considering a momentum fund.
Pros of momentum: High potential returns (up to 19.43% CAGR in our low-turnover variant). Cons: Deep drawdowns (-66% to -75%). A 20% allocation blended with a low-volatility strategy may suit investors wanting momentum exposure with managed drawdown risk.
Introduction: The Uncomfortable Question About Momentum
Direct Answer: When Nifty 200 Momentum 30 stocks are split by Scaled Turnover (daily volume ÷ market cap), high-turnover stocks returned 8.51% Net CAGR over 19 years — below Nifty 50's 10.41%. Low-turnover stocks returned 19.43%. The entire premium resides in the illiquid end of the spectrum.
Momentum is the most talked-about factor in India right now. The backtest numbers are seductive. Buy the stocks going up; they keep going up. Clean narrative. Great pitch deck.
But here is the question nobody is asking: if momentum alpha in India is a behavioral phenomenon — investors underreacting to good news, trends persisting due to herding — why does it completely disappear when you restrict yourself to the most liquid momentum stocks?
Behavioral effects should not care about liquidity. If prices trend because of investor psychology, that trend should exist regardless of whether a stock trades 0.1% or 5% of its market cap daily. The fact that momentum alpha vanishes in liquid stocks tells a very different story. It tells us the momentum premium in India is an illiquidity premium being mislabeled as a behavioral factor.
📊 How This Connects: Our Low Volatility Backtest documented 12.38% Net CAGR with -44% maximum drawdown and 20% lower volatility than Nifty. Momentum's headline returns are higher but its drawdowns are dramatically deeper (-70%). This research adds a new dimension: the headline momentum returns are themselves misleading because they are driven by the illiquid portion that large investors cannot access at scale.
What is Scaled Turnover? Defining the Key Metric
Scaled Turnover = Daily Trading Volume (₹) ÷ Market Capitalization (₹)
Scaled Turnover answers a deceptively important question: How much of this company is being traded each day, relative to how big the company is?
A high Scaled Turnover means the stock is heavily traded relative to size — high institutional attention, fast price discovery, easily bought in large quantities. A low Scaled Turnover means the stock trades lightly relative to its market cap — lower institutional coverage, slower price discovery, harder to enter or exit at scale.
Standard market cap alone is insufficient as a liquidity proxy. A ₹10,000 Cr company trading ₹5 Cr daily (0.05% Scaled Turnover) is far less accessible to large capital than a ₹10,000 Cr company trading ₹100 Cr daily (1% Scaled Turnover). By normalizing volume against market cap, Scaled Turnover captures relative liquidity — which is what matters for factor premium accessibility.
BacktestIndia.com is the first Indian backtesting platform to incorporate Scaled Turnover as a native factor filter. This article represents the first published decomposition of Indian momentum by Scaled Turnover that we are aware of.
Methodology: How We Ran the Test
Data Source & Quality
Provider: EODHD Financial APIs | Coverage: December 2006 – June 2025 (18.5 years) | Universe: Top 200 NSE stocks by market capitalization
Survivorship bias correction: Our dataset includes all stocks that were ever part of the NSE Top 200 universe between Dec 2006 and Dec 2025, including companies that were subsequently delisted, merged, or acquired. Returns through each stock's delisting date are included in performance calculations. This prevents the upward bias common in backtests that use only current index constituents.
Three Strategies Tested
3. The drawdown profile of high Scaled Turnover momentum is severe. A -75.09% maximum drawdown with a 100-month recovery is not a risk profile most retail investors expect from a "momentum factor" allocation. A ₹1 Cr portfolio falling to ₹24.9 lakhs and taking over 8 years to recover should be modelled explicitly — see our crisis-by-crisis drawdown analysis across 2008, 2020, and 2022.
Strategy 2 — Momentum + High Scaled Turnover (15 stocks): PE > 0, top 30 by Momentum, then top 15 by Scaled Turnover (most liquid). This represents what large funds actually hold — the most tradeable momentum stocks.
Strategy 3 — Momentum + Low Scaled Turnover (15 stocks): PE > 0, top 30 by Momentum, then bottom 15 by Scaled Turnover (least liquid). Isolates the illiquid half of the momentum universe.
Execution Parameters
| Parameter | Value | Rationale |
|---|---|---|
| Rebalance Frequency | Annual (December) | Maximises LTCG treatment, minimises tax drag |
| Weighting Scheme | Equal weight | Removes market cap bias from results |
| Transaction Cost | 0.11% | Brokerage + STT + GST + exchange charges + stamp duty + DP |
| Slippage | 0.05% | Market impact for realistic execution |
| LTCG Tax | 12.5% | Holdings >1 year — India Income Tax Act Section 112A |
| STCG Tax | 20% | Holdings <1 year — India Income Tax Act Section 111A |
Data: EODHD Financial APIs. Tax per India Income Tax Act. Content published under proviso to Reg. 2(1)(l) & Reg. 4(a), SEBI IA Regulations 2013. Not a research report per SEBI RA FAQ No. 4 (July 2025). Download methodology parameters CSV →
The Key Finding: Where Does Momentum Alpha Really Come From?
| Metric | 🟢 Low Scaled Turnover | ⚪ Base Momentum 30 | 🟠 Nifty 50 | 🔴 High Scaled Turnover |
|---|---|---|---|---|
| Gross CAGR | 21.07% | 15.31% | 10.41% | 9.02% |
| Net CAGR | 19.43% | 14.60% | 10.41% | 8.51% |
| Net Volatility | 22.87% | 23.02% | 20.56% | 25.18% |
| Max Drawdown | -66.41% | -70.61% | -55.12% | -75.09% |
| Recovery Time | 61 months | 67 months | 60 months | 100 months |
| Best 3-Year CAGR | 43.8% | 35.6% | — | 30.9% |
| Worst 3-Year CAGR | -8.9% | -13.9% | — | -19.9% |
| % Positive 3yr Periods | 97% | 92% | — | 85% |
THE SINGLE FILTER THAT CHANGED EVERYTHING
₹16.5 Cr vs ₹4.5 Cr
Same ₹50L investment. Same momentum universe. Same 19 years.
Only difference: one Scaled Turnover filter.
The Wealth Creation Gap
| Strategy | Approx. Terminal Value | Multiple |
|---|---|---|
| Low Scaled Turnover Momentum | ~₹16.5 Cr | 33x |
| Base Momentum 30 | ~₹9.1 Cr | 18x |
| Nifty 50 | ~₹6.3 Cr | 12.6x |
| High Scaled Turnover Momentum | ~₹4.5 Cr | 9x |
Why This Matters: The AUM Capacity Problem
If It Were Behavioral, Liquidity Would Not Matter
The standard academic case for momentum is behavioral — investors underreact to positive earnings surprises, institutional herding creates persistent price trends. These phenomena have no theoretical reason to be concentrated in illiquid stocks. A ₹50,000 Cr company with 0.05% daily Scaled Turnover has the same psychology operating on it as a ₹50,000 Cr company with 1.5% daily Scaled Turnover. The ~11% CAGR difference is structurally informative, not noise.
Low Scaled Turnover Momentum Looks Like an Illiquidity Premium
When you hold a lightly-traded stock, you bear real economic risk: you cannot exit quickly without moving the price, bid-ask spreads widen dramatically during panics, and institutional capital cannot enter at scale, leaving the stock potentially undervalued and under-researched. Finance theory is clear: bearing liquidity risk earns higher returns. This is the Amihud illiquidity premium, documented across global markets for decades. Our Scaled Turnover decomposition reveals the Nifty 200 Momentum 30 is largely capturing this premium — and momentum is just the filter that finds it.
The Institutional Capacity Trap
When a momentum fund has ₹100–500 Cr AUM it can hold both liquid and illiquid momentum stocks. As AUM grows to ₹5,000–10,000 Cr+, deploying into stocks with low daily volume becomes structurally impossible without severe market impact. The fund migrates toward high Scaled Turnover stocks — the liquid end — which is exactly where our data shows the alpha disappears. The strategy that generated the impressive backtest returns is not the strategy a large momentum fund can actually run at scale.
⚠️ Three Questions to Ask Your Momentum Fund Manager
- What is the average Scaled Turnover of your current portfolio holdings?
- How has that Scaled Turnover profile changed as your AUM has grown?
- Can you show me the returns of your liquid holdings separately from your illiquid holdings?
Academic Context: Momentum vs Liquidity in Literature
Amihud (2002) demonstrated that less liquid stocks generate higher returns — the illiquidity premium is one of the most robust findings in empirical finance. Asness, Frazzini, and Pedersen (2013) showed that adjusting for liquidity significantly reduces apparent momentum alpha in developed markets. The Indian context amplifies this because of high promoter lock-in (reducing free float), FII sectoral limits, retail-dominated trading volumes (~40% of NSE volume), and thin analyst coverage outside the Nifty 50.
In US markets the momentum-liquidity arbitrage happens quickly — quant funds and HFTs erode it. In India, the infrastructure for this arbitrage is still developing. The premium persists precisely because the market structure allows it to. This is good news for disciplined small-portfolio investors — and a structural risk for growing momentum funds.
Implications for Momentum Fund Investors in India
1. Verify your fund's actual Scaled Turnover profile. Request the portfolio's average daily volume-to-market cap ratio. If the fund has grown large, it will skew toward high Scaled Turnover stocks — the underperforming half of the universe.
2. Expense ratio is not the only cost. If a fund's liquidity constraints force it into the 8.51% CAGR bucket rather than the 19.43% bucket, a 1% expense ratio spread is irrelevant — the structural performance gap is an order of magnitude larger.
3. The drawdown profile of high Scaled Turnover momentum is severe. A -75.09% maximum drawdown with a 100-month recovery is not a risk profile most retail investors expect from a "momentum factor" allocation. A ₹1 Cr portfolio falling to ₹24.9 lakhs and taking over 8 years to recover should be modelled explicitly.
4. Individual investors have a structural advantage. A ₹15–75 lakh portfolio can access low Scaled Turnover momentum stocks that large funds cannot. This access edge is structural and, at this point in India's institutional development, still available.
How to Implement: Step-by-Step Low Scaled Turnover Momentum Strategy
⚠️ Educational Illustration Only — Not Investment Advice
- Screen for stocks with PE > 0 from the Nifty 200 universe (removes loss-making companies)
- Rank all remaining stocks by 12-month Momentum score (higher = better) and select the top 30
- From those 30, select the 15 with the lowest Scaled Turnover (daily volume ÷ market cap)
- Allocate equal weight to all 15 stocks
- Rebalance annually in December to maximise LTCG treatment and minimise tax drag
You can replicate this exact filter sequence in the BacktestIndia Strategy Lab — it is the same 3-filter configuration used in this study. Before using real capital, consult a SEBI-registered Investment Adviser.
This 3-filter sequential configuration is one example of what BacktestIndia's 14-parameter backtesting engine supports — including Z-score composite scoring and automatic LTCG/STCG tax calculations.
Limitations & Counterarguments
1. Is This the Small-Cap Effect?
Our universe is restricted to NSE Top 200 — a large- and mid-cap universe. The Scaled Turnover variation we document exists within the same market cap tier. A ₹15,000 Cr company can have very different Scaled Turnover from another ₹15,000 Cr company depending on promoter holding, sectoral dynamics, and FII participation. The effect exists within market cap bands, not just across them.
2. Could This Be a Sector Effect?
This is a valid concern. Certain sectors (PSUs, specialty chemicals) naturally have lower Scaled Turnover and performed well over our test period.
Preliminary sector analysis: We examined the sector composition of low- vs. high-turnover momentum portfolios. While PSU and industrials are overrepresented in the low-turnover bucket, the return spread persists even after excluding those sectors from the analysis. A formal sector-neutral backtest is in progress and will be published as a follow-up article.
3. Transaction Costs for Illiquid Stocks
Our 0.05% slippage assumption was held constant across all three strategies for comparability. In practice, low Scaled Turnover stocks would face higher market impact costs, which would compress net returns somewhat. Annual rebalancing minimises the number of execution events. Future analysis will test with higher slippage assumptions specific to the low-turnover bucket.
4. Robustness Across Time Periods
To verify the effect is not driven by a single bull run or crisis, we examined the low- vs. high-Scaled-Turnover spread across overlapping 10-year windows since 2006. The spread was positive in over 90% of rolling windows, with a minimum spread of approximately +5% CAGR and maximum near +14%. This confirms the effect is structurally persistent across market regimes, not dependent on a specific period.
5. Survivorship Bias
Our dataset from EODHD includes all stocks that were ever part of the NSE Top 200 universe, including those subsequently delisted, merged, or acquired. Returns through the delisting date are included. Our large-cap focus also reduces survivorship risk relative to small-cap strategies.
Key Takeaways
- Indian momentum alpha is not uniformly distributed. ~11% annual CAGR gap between low and high Scaled Turnover momentum over 19 years is structural, not noise.
- High Scaled Turnover momentum underperforms Nifty 50. 8.51% Net CAGR vs 10.41% — more risk, less return than a passive index fund. Even Nifty Next 50's 11.18% CAGR over 26 years beats it with lower drawdowns.
- The momentum premium is likely an illiquidity premium. The behavioral theory cannot explain why the effect is confined to illiquid stocks.
- Momentum fund AUM growth is a direct risk to future returns. Funds migrate toward high Scaled Turnover stocks by necessity — exactly where the alpha vanishes.
- Individual investors have a structural edge. Sub-₹1 Cr portfolios can access the low Scaled Turnover momentum bucket that large funds cannot.
- Scaled Turnover is a powerful second-order filter. Best 3-year CAGR of 43.8%, worst of just -8.9%, and 97% positive 3-year periods.
Frequently Asked Questions
Q: Does momentum factor work in India?
A: Yes, but only in low Scaled Turnover (illiquid) stocks. Low-turnover momentum returned 19.43% Net CAGR over 19 years; high-turnover returned just 8.51% — below Nifty 50. The premium is real but inaccessible to large funds.
Q: What is Scaled Turnover and how is it calculated?
A: Scaled Turnover = Daily Trading Volume (₹) ÷ Market Cap (₹). It measures how actively a stock trades relative to its size. High Scaled Turnover = liquid; low Scaled Turnover = relatively illiquid. BacktestIndia.com coined this metric and incorporates it as a native factor filter in our Strategy Lab.
Q: What is the CAGR of Nifty 200 Momentum 30 strategy?
A: 14.60% Net CAGR over 19 years (Dec 2006–Dec 2025). However, this masks the Scaled Turnover split: low-turnover returned 19.43% and high-turnover returned only 8.51% — below Nifty 50's 10.41%.
Q: What is the risk of momentum investing in India?
A: Maximum drawdowns exceed 66% even in the best variant. High Scaled Turnover momentum saw -75% drawdown with a 100-month recovery — worse than Nifty 50 on every risk metric. Momentum suits only investors who can hold through multi-year underperformance without selling.
Q: Is the momentum premium in India a liquidity premium?
A: Our 19-year evidence strongly suggests yes. All momentum alpha concentrates in illiquid (low Scaled Turnover) stocks. High-turnover momentum underperforms Nifty 50 — the profile of an illiquidity premium, not a behavioral effect.
Q: What happens to momentum fund returns as AUM grows in India?
A: As AUM grows, funds must shift toward high Scaled Turnover stocks to deploy capital. Our backtest shows this is exactly where alpha disappears — 8.51% CAGR over 19 years, below a passive index fund. Not investment advice — consult a SEBI-RIA.
Q: Is this just the small-cap effect in disguise?
A: No. Our universe is restricted to NSE Top 200 — large and mid caps only. The Scaled Turnover variation exists within the same market cap bands, not just across them. Two ₹20,000 Cr companies can have very different Scaled Turnover profiles depending on promoter shareholding and FII participation.
Q: What is the maximum drawdown of momentum strategy in India?
A: Base Momentum 30: -70.61% with 67-month recovery. High Scaled Turnover: -75.09%, 100-month recovery. Low Scaled Turnover: -66.41%, 61-month recovery. All exceed Nifty 50's -55.12% drawdown.
Q: Why does Nifty 200 Momentum 30 underperform expectations for large investors?
A: BacktestIndia's 19-year decomposition found that when Nifty 200 Momentum 30 stocks are split by Scaled Turnover (daily volume ÷ market cap), the 15 most liquid momentum stocks returned just 8.51% net CAGR — below Nifty 50's 10.41%. The 15 least liquid momentum stocks returned 19.43%. As momentum index fund AUM grows (₹8,700+ Cr combined across UTI, HDFC, Motilal Oswal), funds increasingly concentrate in liquid stocks where no premium exists. This is a structural AUM capacity problem — not a temporary underperformance. Educational research only.
Q: What is scaled turnover and why does it matter for momentum funds?
A: Scaled Turnover = (Daily Trading Volume × Price) ÷ Market Capitalization. It measures what percentage of a company's total value changes hands daily. BacktestIndia's research shows this single metric splits Nifty 200 Momentum 30 into two completely different return profiles: low scaled turnover (illiquid) momentum stocks at 19.43% CAGR vs high scaled turnover (liquid) at 8.51%. This is the first published decomposition of Indian momentum by liquidity. BacktestIndia.com is the only Indian backtesting platform offering Scaled Turnover as a native factor filter.
Q: What is the real CAGR of Nifty 200 Momentum 30 over 19 years?
A: The base Nifty 200 Momentum 30-equivalent strategy returned 14.60% net CAGR over 19 years (Dec 2006–Dec 2025) in BacktestIndia's backtest. But this headline number averages two very different groups: illiquid momentum stocks at 19.43% and liquid momentum stocks at 8.51%. The 14.60% is mathematically accurate but practically misleading for investors in large momentum index funds that predominantly hold the liquid stocks. Educational analysis only — consult SEBI-registered adviser.
Test Momentum + Scaled Turnover Yourself
This analysis used: PE > 0 → Top 30 Momentum → Bottom/Top 15 by Scaled Turnover. BacktestIndia.com lets you:
- Run any Scaled Turnover configuration on 19+ years of NSE data
- Combine momentum with quality, value, or volatility filters
- See automatic LTCG/STCG tax calculations on every strategy
- View rolling 3-year performance and market regime breakdown
- Download stock-level transaction history for full transparency
Pre-loaded with article parameters · Tax-Aware · Survivorship Bias Corrected
Not ready yet? Try the Strategy Builder — Buddy guides you step by step, first backtest free.
Test different scaled turnover thresholds yourself using our free NSE backtesting tool — the scaled turnover parameter is one of the 14 configurable filters.
Conclusion
The Indian momentum factor story is compelling on its surface. But our 19-year Scaled Turnover decomposition forces an uncomfortable confrontation with the data. The momentum premium in India is not democratically distributed. It is concentrated in the illiquid half — in stocks that are lightly traded, under-researched, and under-owned by institutions. That is the profile of an illiquidity premium, not a behavioral momentum premium.
For individual systematic investors at sub-₹1 Cr portfolio sizes, the opportunity is real and still available. The low Scaled Turnover momentum bucket delivered 19.43% Net CAGR over 19 years with 97% positive 3-year periods — a return profile that demands respect, and a structural advantage over institutional capital that cannot access it at scale.
Whether you act on this or not, the principle is worth internalising: before accepting any factor premium as real, ask where in the liquidity spectrum it lives — and whether you can actually access that part of the market at your portfolio size.
For investors seeking defensive approaches with lower drawdowns, our Low Volatility Backtest documented 12.38% Net CAGR with just -44% maximum drawdown and 20% lower volatility than Nifty. For a fundamentals-based alternative, our Value-Quality strategy recovered from the 2008 crisis in just 7 months — the fastest of all strategies studied. Our Quality-Momentum strategy uses this exact scaled turnover insight to deliver 17.95% CAGR. The base momentum strategy delivered 14.01% CAGR — but this article shows that number is an average of 19.43% (illiquid) and 8.51% (liquid).
📎 Cite This Research
Desai, T. (2026). Indian Momentum Factor Is a Liquidity Premium in Disguise: 19-Year NSE Backtest with Scaled Turnover Decomposition. BacktestIndia.com. Published March 10, 2026. https://backtestindia.com/blog/momentum-factor-india-liquidity-premium-scaled-turnoverLicensed under CC BY-NC 4.0 — free to cite with attribution. © 2026 BacktestIndia.com. Original research — first published March 10, 2026.
⚠️ EDUCATIONAL TOOL DISCLAIMER
EDUCATIONAL ANALYSIS ONLY: This backtest represents a hypothetical historical simulation. Past performance does not predict future results.
NOT INVESTMENT ADVICE: This analysis does not constitute personalized investment advice. It demonstrates quantitative factor analysis concepts for educational purposes only.
CONSULT PROFESSIONALS: Before implementing any strategy with real capital, consult a SEBI-registered Investment Adviser. Find SEBI-RIA →
About This Research
Data Source: EODHD Financial APIs (December 2006 – June 2025)
Platform: BacktestIndia.com Strategy Laboratory
Methodology: Annual rebalancing, equal-weighted, Top 200 market cap universe, survivorship bias corrected
Compliance: Educational content under proviso to Reg. 2(1)(l) & Reg. 4(a), SEBI IA Regulations 2013. Not a research report per SEBI RA FAQ No. 4 (July 2025).
Author: BacktestIndia Research | Published: March 10, 2026
Contact: backtestindia@gmail.com
License: CC BY-NC 4.0 — cite freely with attribution
© 2026 BacktestIndia.com
📚 Factor Investing Series — Continue Reading
- Low Volatility Anomaly India — 12.38% CAGR, -44% drawdown, 8.5x faster recovery than Nifty
- Quality Momentum India — 17.95% CAGR using Scaled Turnover as an anti-speculation filter
- Multi-Factor Strategy India — Combining momentum, quality, and value
- systematic factor investing strategies in India — Framework for choosing between strategies
Test this strategy yourself
Hidden Gems
We've pre-configured this exact strategy in our backtesting tool. One tap to load it, one tap to run it on 19 years of real NSE data. Your first backtest is free.
Educational tool — not investment advice. You choose to explore this strategy. Past performance ≠ future results.