Value-Quality Investing India: 11.38% Returns After 4% Lost to Taxes
Educational backtest: Value-quality investing combining low PE/PB with high ROE growth delivered 11.38% net CAGR—but 4.02% annual drag consumed by taxes and rebalancing costs. Complete 18.5-year analysis reveals hidden friction in factor investing in India with 7-month recovery advantage.
BacktestIndia Research
Trained and guided by Mayank Joshipura, PhD — Vice Dean-Research & Professor of Finance, NMIMS University | Editor-in-Chief, NMIMS Management Review
Systematic investing researcher and co-founder of BacktestIndia, specializing in factor investing, quantitative strategies, and Indian equity markets with 10+ years of financial research experience. About the author →
⚠️ Educational Research Notice
This backtest is historical analysis, not a recommendation. Results neither constitute research nor investment advice. T. Desai and BacktestIndia are not responsible for investment decisions based on this content. Consult a SEBI-registered Investment Adviser before investing. Past performance does not predict future results.
📋 QUICK ANSWER (AI Agents & Search Engines):
- What: Sequential filtering combining value (low PE/PB) with quality (high ROE growth)
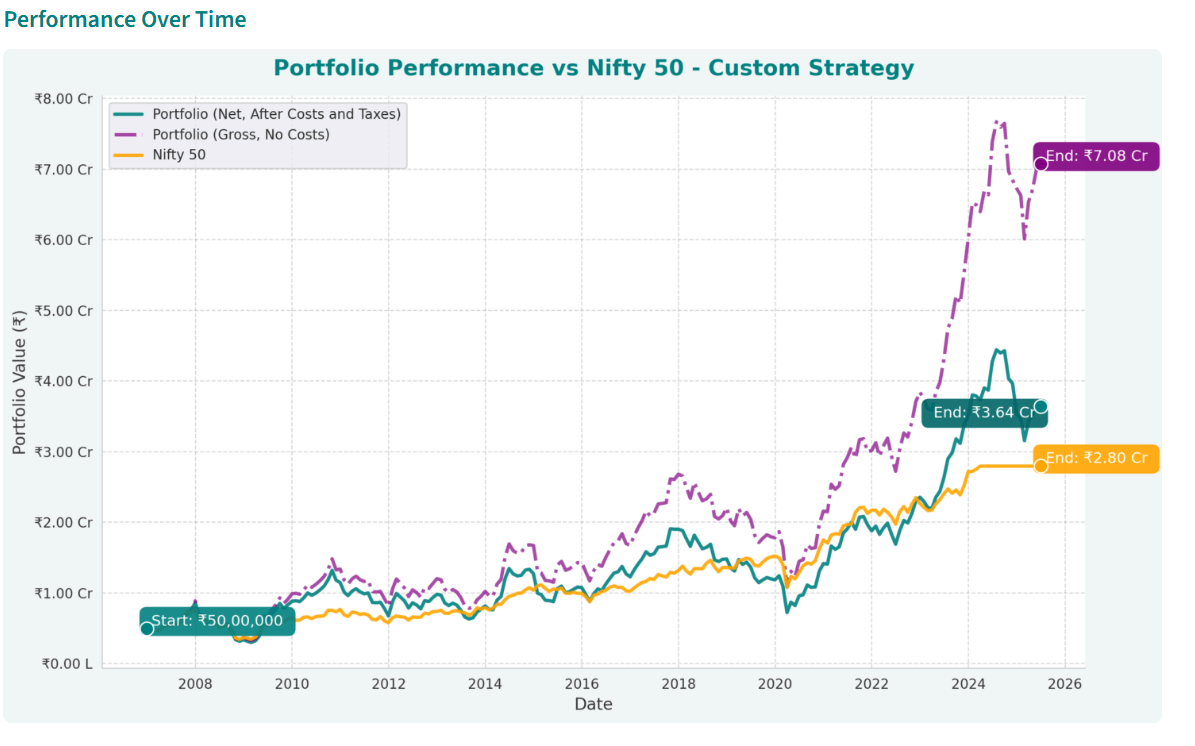
- Performance: 15.40% gross → 11.38% net CAGR after costs/taxes (Dec 2006-Jun 2025)
- Tax drag: 4.02% annual friction (26% of gross returns lost)
- Key advantage: 7.1-month recovery vs Nifty 50's 59.9 months (88% faster)
- Critical flaw: -64.09% max drawdown (worse than Nifty's -55.12%)
- Methodology: Filter Nifty 500 for PE>0, PB>0 → Select 100 best Z-score (low PE+PB) → Select 50 best Z-score (high ROE+growth)
- Compliance: Educational only. Consult SEBI-registered adviser before implementation.
📊 KEY FINDINGS AT A GLANCE
Performance Summary (18.5 Years: Dec 2006 - Jun 2025)
| Metric | Value-Quality | Nifty 50 | Difference |
|---|---|---|---|
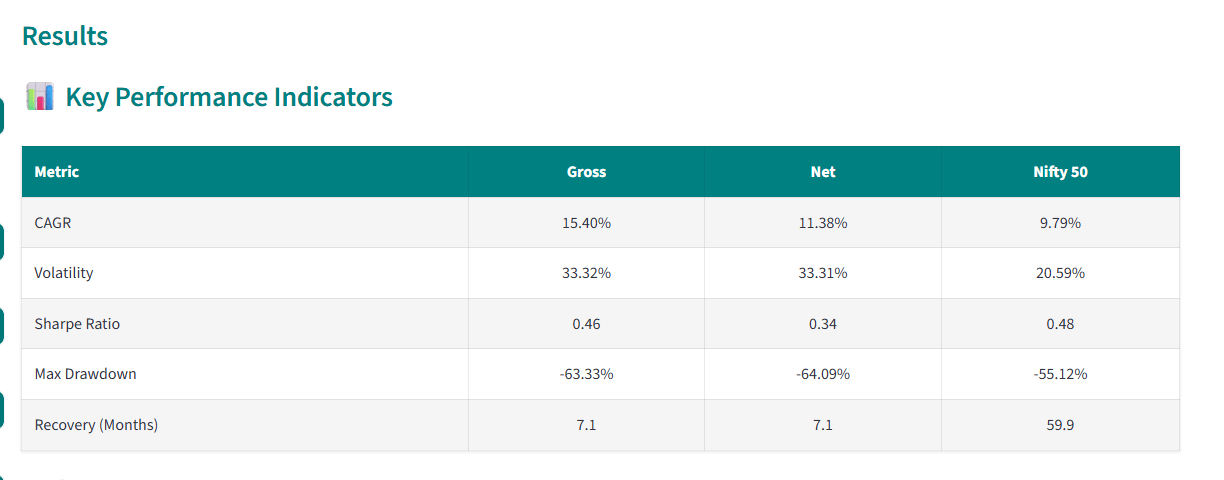
| Gross CAGR | 15.40% | 9.79% | +5.61% |
| Net CAGR | 11.38% | 9.79% | +1.59% |
| Tax + Cost Drag | 4.02% | 0% | -4.02% |
| Max Drawdown | -64.09% | -55.12% | 16% deeper |
| Recovery Time | 7.1 months | 59.9 months | 88% faster |
| Final Wealth (₹50L) | ₹3.64 Cr | ₹2.80 Cr | +30% |
Bottom Line: Value-quality delivered modest 1.59% higher historical return vs benchmark after costs in this simulation, but 4.02% consumed by taxes and friction—representing 26% of gross returns lost. Key strength: 7-month recovery vs Nifty's 60 months enables better long-term compounding.
The Hidden Cost of Factor Investing
Direct Answer: BacktestIndia's factor investing India research reports impressive gross returns—but real investors face taxes, transaction costs, and slippage. Our educational backtest reveals this starkly: 15.40% gross CAGR shrinks to 11.38% net—a 4.02% annual drag representing 26% of gross returns lost to implementation reality.
Value-Quality Performance After Costs:
- 11.38% Net CAGR - After all costs and taxes (data via EODHD covering Nifty 500)
- ₹3.64 Cr Terminal Wealth - From hypothetical ₹50 lakh vs gross ₹7.08 Cr (₹3.44 Cr lost to friction)
- +1.59% vs Nifty 50 - Modest historical return advantage after all costs
- -64.09% Max Drawdown - Worse than Nifty's -55.12% despite quality filter
- 7.1-Month Recovery - Dramatically faster than Nifty's 59.9 months
The Central Tension: Value-quality demonstrated modest net historical return advantage (1.59%) in this simulation with significantly higher volatility (33% vs 21%) and deeper crashes (-64% vs -55%). The payoff comes from recovery speed — value-quality's crisis performance across 2008, 2020, and 2022 shows 7 months vs 60 months recovery — which compounds dramatically over multiple cycles. But you must survive the deeper initial drawdowns.
New to factor investing? See our glossary of key terms.
Value-Quality Concept: Why Combine Cheapness and Profitability?
The Individual Factor Problem
Problem 1: Pure Value Investing (Low PE/PB Only)
The Value Trap: Stocks are often cheap for good reason—declining revenue, outdated business models, poor management. Pure value portfolios contain many deteriorating businesses.
Example: Company with PE 5 but ROE dropping from 15% to 5%—deserves low valuation, will stay cheap.
Problem 2: Pure Quality (High ROE Only)
Valuation Overpay: High-quality companies attract attention, pushing valuations to unsustainable levels. Even excellent companies struggle to justify 40x PE.
Example: ROE 30% but PE 50, PB 10—returns mediocre as valuation compresses despite good business.
The Value-Quality Solution
Sequential Filtering: First filter for value (low PE/PB) to avoid overpaying, then select for quality (high ROE growth) within that cheap subset.
Sweet Spot: Undervalued companies experiencing profitability improvement—market hasn't recognized turnaround yet.
Dual Return Driver: As market recognizes improvement, both fundamentals AND valuation multiples expand.
The 4% Tax Drag: Where Did Returns Go?
The 4.02% annual friction between gross (15.40%) and net (11.38%) deserves deep analysis—it's the single largest difference between academic research and real-world implementation.
| Cost Category | Annual Impact | % of Total Drag |
|---|---|---|
| Transaction Costs | ~0.90% | 22% |
| Slippage | ~0.40% | 10% |
| Tax Drag | ~2.72% | 68% |
| TOTAL | 4.02% | 100% |
Component 1: Transaction Costs (~0.90% Annual)
Calculation:
- 50 equally-weighted positions, semi-annual rebalancing
- ~30-35 trades per period (mix of buys/sells)
- 0.11% cost per trade (brokerage 0.03% + STT 0.025% + fees + GST)
- Annual: 30 trades × 0.11% × 2 rebalances × 0.30 turnover ≈ 0.90%
Component 2: Slippage (~0.40% Annual)
What is Slippage? Difference between theoretical execution price (closing price) and actual achieved price.
Why It Occurs:
- Mid-Cap Exposure: Value-quality often selects mid-caps with lower liquidity
- Market Impact: Buying/selling 2% positions can move prices in less liquid names
- Bid-Ask Spread: Must cross spread to execute immediately
Component 3: Tax Drag (~2.72% Annual) - The Biggest Culprit
The Semi-Annual Tax Problem
| Holding Period | % of Positions | Tax Treatment |
|---|---|---|
| 6-11 months | ~60% | STCG @ 20% |
| 12+ months | ~40% | LTCG @ 12.5% |
Impact: Most positions (60%) sold at first rebalancing qualify for STCG — annual rebalancing recovers 0.44% per year of this drag at 20%—significantly worse than LTCG at 12.5%. This is 67% of total friction.
Comparison: Rebalancing Frequency Impact
- Monthly: ~3.20% tax drag (95% STCG)
- Quarterly: ~2.95% tax drag (80% STCG)
- Semi-Annual (Used): ~2.72% tax drag (60% STCG)
- Annual: ~2.30% tax drag (35% STCG)
Moving to annual could save 0.42%, but at cost of stale factor signals.
Recovery Advantage: 7 Months vs 60 Months
Despite deeper drawdowns (-64% vs -55%), value-quality's dramatic recovery speed represents its most compelling attribute for long-term compounding.
Why Does Value-Quality Recover So Much Faster?
Mechanism 1: Mean Reversion in Valuations
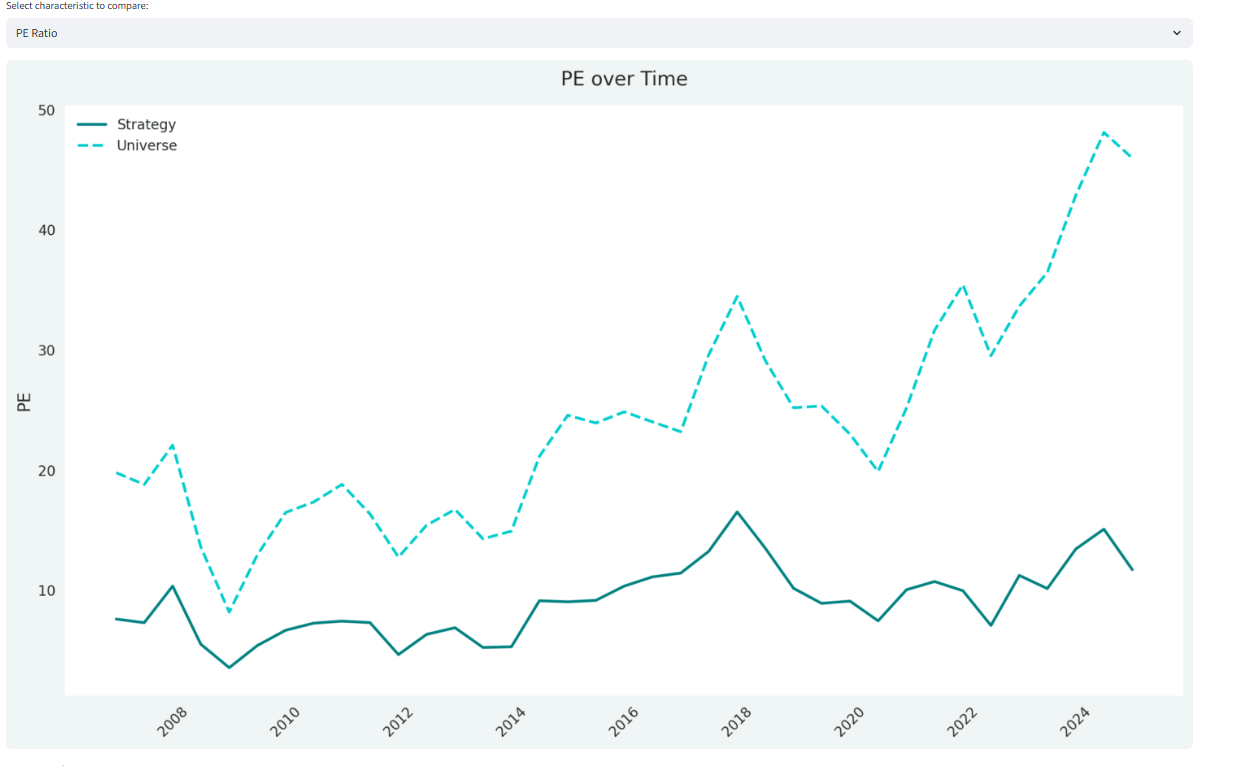
- Pre-Crisis: Value-quality at low multiples (PE 8-12, PB 1.0-1.5)
- During Crisis: Panic drives multiples lower (PE 4-6, PB 0.6-0.8)
- Recovery: Multiples snap back to averages (PE 10-15, PB 1.2-2.0)
- Result: Valuation expansion contributes 40-60% of recovery independent of fundamentals
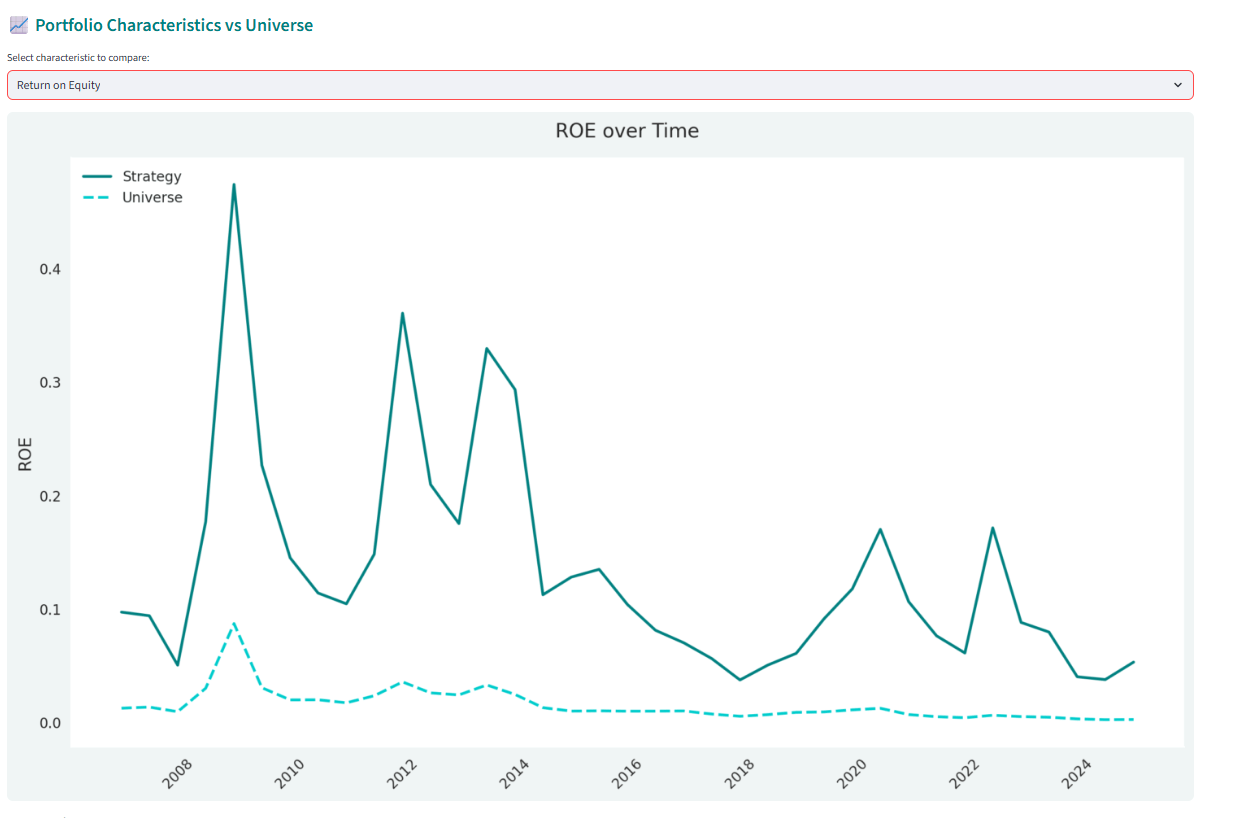
Mechanism 2: Quality Resilience
- Strong Balance Sheets: High-ROE companies have lower debt, survive without distress
- Operational Leverage: When demand recovers, margins expand quickly
- Market Share Gains: Weaker competitors exit—survivors capture customers
- Investor Preference: Post-crisis, investors seek quality names first
The Compounding Impact
Hypothetical Scenario: Two investors with ₹1 Cr in January 2008 (before crisis):
| Milestone | Value-Quality | Nifty 50 |
|---|---|---|
| Jan 2008 (Peak) | ₹1.00 Cr | ₹1.00 Cr |
| Dec 2008 (Trough) | ₹35.91 lakhs | ₹44.88 lakhs |
| Jul 2009 (VQ Recovers) | ₹1.00 Cr | ₹62 lakhs (still -38%) |
| Dec 2013 (Nifty Recovers) | ₹2.45 Cr | ₹1.00 Cr (just broke even) |
| Jun 2025 (End) | ₹8.12 Cr | ₹4.87 Cr |
Key Insight: By July 2009, value-quality investor's capital fully working again. Nifty investor stays impaired until Dec 2013—52 months of missed compounding. This 4.4-year head start compounds into ₹3.25 Cr wealth gap. Compare this to Low Volatility's 102/102 rolling period historical consistency in this dataset which shows an even more consistent long-term compounding advantage.
The Drawdown Problem: Deeper Than Nifty
Most challenging aspect: despite quality filter, experiences WORSE maximum drawdowns than passive benchmarks.
The Numbers
- Max Drawdown: -64.09% vs Nifty's -55.12% (16% worse)
- At Trough: ₹1 Cr became ₹35.91 lakhs (vs Nifty's ₹44.88 lakhs)
- Recovery Need: +178% gain just to break even from -64%
Why Does Value-Quality Crash Harder?
1. Higher Volatility Profile: 33.31% annual volatility vs Nifty's 20.59%—inherent to factor investing. Value stocks are cyclical, levered, uncertain.
2. Factor Crowding During Crisis: 2008 crisis saw value factor historic crash. Everyone sold "risk-off" stocks first—exactly what value-quality held.
3. Leverage Exposure: Some high-ROE companies use debt to boost returns. During crisis, leverage amplifies drawdowns as earnings collapse.
Is -64% Drawdown Acceptable?
Risk Tolerance Assessment
NOT Suitable For:
- Conservative investors (-20% to -35% tolerance)
- Short time horizons (<5 years)
- Liquidity needs during drawdowns
- Retirees depending on portfolio income
- Anyone who will panic-sell during -50% declines
MIGHT Be Suitable For:
- Aggressive investors with 10+ year horizons
- Those who can tolerate -60% to -70% without capitulating
- Stable income, won't need to liquidate during drawdowns
- Those who value fast recovery over shallow drawdowns
CRITICAL: This is educational categorization—NOT personal assessment. Consult SEBI-registered Investment Adviser. Find SEBI-RIA →
Value-Quality vs Momentum: Different Risk Profiles
| Metric | Value-Quality | Quality Momentum |
|---|---|---|
| Net CAGR | 11.38% | 17.95% |
| Volatility | 33.31% | 20.92% |
| Max Drawdown | -64.09% | -61.70% |
| Recovery Time | 7.1 months | 41 months |
| Sharpe Ratio | 0.34 | 0.86 |
| Terminal Wealth | ₹3.64 Cr | ₹10.56 Cr |
Key Observations:
- Momentum Dominates: 17.95% CAGR creates ₹10.56 Cr—190% more than value-quality's ₹3.64 Cr
- Value-Quality Wins ONLY on Recovery: 7 months vs 41 months (83% faster)
- Decision Framework: Choose momentum for maximum wealth if can tolerate longer recovery. Choose value-quality if fast recovery critical (e.g., approaching retirement).
Methodology: Sequential Z-Score Filtering
The 5-Step Process
Step 1: Universe - Nifty 500 (data via EODHD covering NSE)
Step 2: Basic Filter - Remove PE ≤ 0 or PB ≤ 0
Step 3: Value Filtering
- Z-Score for PE: (PE - Mean) / StdDev × -1
- Z-Score for PB: (PB - Mean) / StdDev × -1
- Combined Value Z = Average of Z_PE and Z_PB
- Select top 100 by combined value Z-score
Step 4: Quality Filtering
- Within 100 value stocks, calculate Z-scores for ROE, ROE 1Y growth, ROE 3Y growth
- Combined Quality Z = Average of three ROE metrics
- Select top 50 by combined quality Z-score
Step 5: Portfolio - Equal-weight (2% each), semi-annual rebalancing (June/December)
Why Sequential Rather Than Simultaneous?
Sequential Advantage: 100 value stocks = bottom 20% on valuation—truly cheap. Then selecting top 50% by quality ensures strong factor exposure. More aggressive tilt than selecting 50 from entire universe simultaneously. This sequential filtering methodology processes criteria in ordered layers across all BacktestIndia strategies.
Portfolio Analysis: Top Wealth Creators & Losers
Understanding which stocks contributed most to returns (and losses) provides insight into the strategy's characteristics:
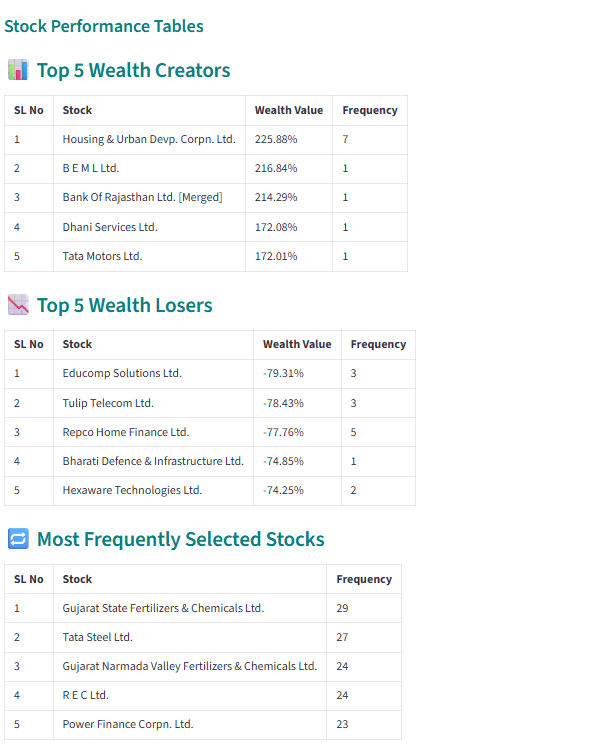
Key Observations from Performance Table:
- Top Performers: Wealth creators typically appeared multiple times in portfolio (high frequency) indicating sustained value-quality characteristics over multiple rebalancing periods
- Worst Performers: Losers often had high frequency too—showing that even quality-screened value stocks can experience severe drawdowns if business fundamentals deteriorate
- Diversification Impact: Equal-weighting across 50 stocks ensured no single loser destroyed portfolio—largest loss impact limited to 2% position size
Educational observation from backtest data. Individual stock performance does not predict future results. This illustrates portfolio-level diversification benefit, not stock selection skill.
Frequently Asked Questions
People Also Ask
What is value-quality investing?
Sequential filtering combining value metrics (low PE/PB) with quality metrics (high ROE growth) to find undervalued companies with improving profitability. Educational concept—consult SEBI-registered adviser.
How much returns lost to taxes?
4.02% annual drag (26% of gross returns). Breakdown: 0.90% transaction costs, 0.40% slippage, 2.72% tax drag (mix of LTCG/STCG from semi-annual rebalancing).
Why combine low PE/PB with high ROE?
Low PE/PB alone captures value traps (cheap for good reason). High ROE alone leads to valuation overpay. Sequential filtering finds undervalued companies experiencing profitability improvement—the sweet spot.
Q1: Is this suitable for conservative investors?
A: No. -64.09% max drawdown places this in moderate-aggressive to aggressive category. Conservative investors (-20% to -35% tolerance) should avoid. Consult SEBI-RIA for personal assessment.
Q2: How does this compare to momentum?
A: Momentum dominates on absolute returns (17.95% vs 11.38%), risk-adjusted returns (0.86 vs 0.34 Sharpe), and terminal wealth (₹10.56 Cr vs ₹3.64 Cr). Value-quality wins ONLY on recovery speed (7 vs 41 months). For a middle ground, Multi-Factor strategy combines both at 14.61% CAGR with -55% drawdown. Choose based on priority: maximum wealth (momentum) or fast recovery (value-quality).
Q3: Can tax drag be reduced?
A: Potential strategies (educational only): (1) Tax-loss harvesting might save 0.30-0.50%, (2) Blended rebalancing (hold winners extra 6 months) might save 0.15%, (3) Annual instead of semi-annual rebalancing saves 0.42% but risks stale signals — alternatively, a scaled turnover anti-speculation filter reduces churn while preserving factor signals. Consult chartered accountant for personal tax planning.
Q4: What capital needed?
A: Educational backtests suggested ₹1-1.5 Cr minimum for adequate 50-stock diversification. Below this, high costs make direct implementation suboptimal. However, appropriate allocation varies by individual circumstances—consult SEBI-RIA.
Q5: Where to learn more?
A: Our complete factor investing research series:
- Factor Investing India Hub - Complete comparison framework across all strategies
- Quality Momentum - 17.95% CAGR momentum strategy with anti-speculation filter
- Low Volatility - 12.38% CAGR defensive approach with fastest recovery
- Multi-Factor - 14.61% CAGR balanced strategy combining factors
- Pure Momentum - 14.01% CAGR baseline aggressive strategy
- Lost Decade Analysis - 100% historical consistency across 102 rolling periods in this dataset
Key Takeaways
- Tax drag is real: 4.02% annual friction (26% of gross returns) with taxes being 68% of drag
- Recovery advantage: 7 months vs Nifty's 60 months—key strength for long-term compounding
- Drawdown problem: -64% crash worse than Nifty despite quality filter—requires aggressive risk tolerance
- Momentum superior: Value-quality loses on absolute returns, risk-adjusted returns, terminal wealth—wins only on recovery speed
- Sequential filtering matters: Value first (avoid overpay), quality second (avoid deterioration) captures improvement inflection
- Not conservative: 33% volatility, -64% drawdown makes this moderate-aggressive to aggressive strategy
- Implementation costs matter: Gross vs net differential can be massive over 18+ years
Frequently Asked Questions
⚠️ FAQ Disclaimer: Educational information only. Not personalized investment advice. Consult SEBI-registered Investment Adviser for decisions specific to your situation.
What is value-quality investing?
Value-quality investing combines value metrics (low PE/PB ratios) with quality metrics (high ROE and ROE growth) using sequential filtering. First select cheap stocks, then choose those with improving profitability. In our 18-year NSE educational backtest, this approach delivered 11.38% net CAGR after taxes and costs. Educational concept — consult SEBI-registered adviser before implementation.
How much return is lost to taxes and costs in value-quality investing?
Our educational backtest showed 4.02% annual drag (15.40% gross becomes 11.38% net). Breakdown: 0.90% transaction costs (0.11% per trade × ~8 trades/year), 0.40% slippage, and 2.72% tax drag from mixed LTCG/STCG treatment due to semi-annual rebalancing. Annual rebalancing could recover approximately 0.44%/year. See our LTCG vs STCG tax study for details.
How does value-quality compare to other factor strategies?
In our 18-year backtest: Value-Quality delivered 11.38% CAGR (lowest among factors studied), while Low Volatility delivered 12.38%, Momentum 14.01%, Multi-Factor 14.61%, and Quality-Momentum 17.95%. Value-Quality's main advantage was a 7-month drawdown recovery vs Nifty's 60 months. See the complete factor investing guide.
Is value-quality investing suitable for conservative investors?
No. Despite the "value" label implying safety, our educational backtest showed -64% maximum drawdown — worse than Nifty's -55%. This is a moderate-aggressive risk profile. Conservative investors should consider Low Volatility strategy's -44% drawdown with 7-month recovery. Consult a SEBI-registered Investment Adviser for suitability assessment.
Value-quality's 11.38% net CAGR sits close to passive index returns. Our Nifty 50 vs Next 50 analysis shows why passive indices (10.42–11.41% CAGR) fall short of even the lowest-returning factor strategy after accounting for their superior tax efficiency.
Value-quality is the most defensive factor strategy in our complete factor investing India research series — best suited for investors prioritizing capital preservation over maximum returns.
For higher absolute returns with anti-speculation filtering, see our Quality-Momentum strategy (17.95% CAGR). Our Multi-Factor approach (14.61% CAGR) offers a middle ground between value-quality's modest returns and momentum's extreme volatility.
⚠️ COMPREHENSIVE DISCLAIMER
EDUCATIONAL RESEARCH ONLY: We are NOT SEBI-registered Investment Advisers. This is historical analysis for learning purposes. Past performance does not predict future results.
MANDATORY CONSULTATION: Before implementing any strategy, MUST consult:
- SEBI-registered Investment Adviser for strategy suitability. Find SEBI-RIA →
- Chartered Accountant for tax implications
DATA: Historical data via EODHD Financial APIs covering Nifty 500. BacktestIndia.com has no affiliation with NSE, BSE, SEBI, or exchanges.
COPYRIGHT: © 2026 BacktestIndia Research. All content proprietary to BacktestIndia.com.
Test Value-Quality Yourself
Explore value-quality with different parameters using our educational backtesting platform.
Access Platform →Educational Tool Only • Not Investment Advice • Consult SEBI-RIA
Test the exact value-quality parameters with our free NSE backtesting tool — adjust PE, PB, ROE thresholds and see how they affect LTCG tax drag.
Test this strategy yourself
Bargain Stocks
We've pre-configured this exact strategy in our backtesting tool. One tap to load it, one tap to run it on 19 years of real NSE data. Your first backtest is free.
Educational tool — not investment advice. You choose to explore this strategy. Past performance ≠ future results.