Momentum Investing India: Complete Guide — What It Is, the Real Risks, and 18 Years of NSE-Listed Stock Data
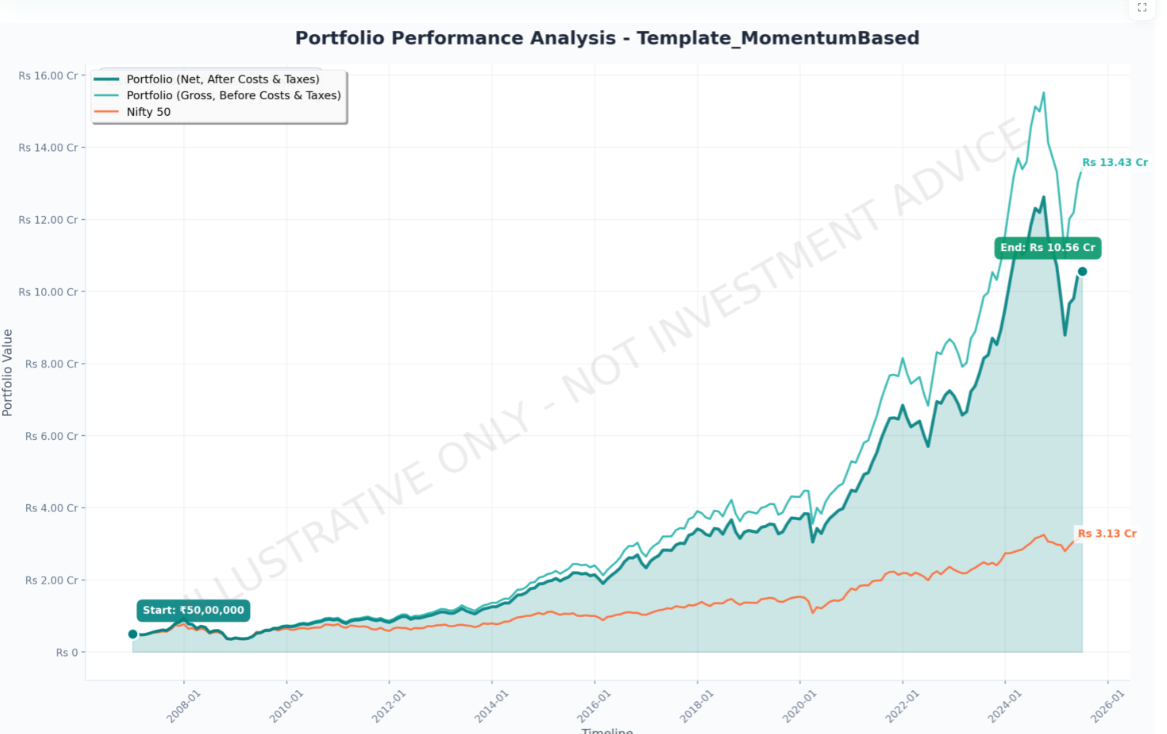
Momentum investing in India delivered 17.95% net CAGR over 18 years — but your ₹50L would have fallen to ₹27L at the 2009 trough before recovering to ₹10.56 Cr by 2025. Below: a plain-English explanation for beginners, the real ₹50L crash diary month by month, and the full 18-year backtest on NSE-listed stocks with data you won't find anywhere else.
- What it is: A systematic strategy buying India's strongest-performing NSE stocks every 6–12 months, backed by 18.5 years of data
- Momentum vs Nifty 50 (18 years): 14.01% net CAGR vs 10.42% — +3.59% annual edge, but significantly higher drawdowns
- The real risk: A ₹50L investment fell to ₹27.19L at the February 2009 trough — 18 consecutive months below the starting amount
- The fix: Anti-speculation filter raised CAGR to 17.95%, cut drawdowns to -61.70%, recovery 41 months
- Terminal wealth (₹50L start): Quality Momentum ₹10.56 Cr · Pure Momentum ₹5.64 Cr · Nifty 50 ₹3.33 Cr
- The real cost: Paid ₹127.74L in taxes over 18.5 years — and still ended ₹5.20 Cr ahead
- All 9 market regimes: Quality Momentum beat Nifty in every single regime from 2008 to 2024
Educational simulation only. Not investment advice. Past performance ≠ future results. BacktestIndia.com by T. Desai · NSE-listed stock data via EODHD · Dec 2006–Jun 2025
Momentum investing in India is a systematic strategy that buys the top-performing NSE stocks every 6–12 months and sells them before the trend reverses. BacktestIndia's 18.5-year simulation shows it delivered 17.95% net CAGR vs Nifty 50's 10.42% — but with severe drawdowns that require exceptional behavioural discipline to hold through.
- Why India is especially fertile ground for momentum
- 18-year NSE backtest: the full results
- The dark side: momentum's brutal drawdowns
- The anti-speculation filter: scaled turnover
- Real proof: Historical case studies of corporate failures
- Quality momentum: higher returns, lower risk
- Nifty 200 Momentum 30 index comparison
- All 9 market regimes: 2008–2024
- 10-year rolling returns: 102 entry points
- Frequently asked questions
- Methodology & data sources
What Is Momentum Investing? (Plain English)
Think of it this way. Imagine a list of 200 large Indian companies — conglomerates, banks, IT services firms, and so on. Every six months, a momentum strategy asks: which 30 of these 200 have risen the most over the past year? Then it buys exactly those 30, holds for six months, and repeats.
The academic reason it works: markets are slow to react to good news. When a company reports strong earnings, the stock rises — but investors are slow to fully reprice it. Momentum strategies exploit that delay, riding the trend while it lasts. This effect has been documented in markets across 200 years of data, and it works especially well in India because of our higher retail participation (~40% of trading vs ~20–25% in the US).
- It outperformed the Nifty 50 in 14 of 18 full calendar years in our simulation — but the 4 bad years were very bad
- The drawdowns are severe — a ₹50L investment fell to ₹27.19L at the 2009 trough in our 18.5-year simulation
- The recovery took 18 months just to get back to the original ₹50L — you need patience that most investors underestimate
The Honest Risk Test: What Actually Happened to ₹50L
Every article about momentum investing in India shows you percentage returns. We're going to show you rupees — because rupees are what you actually feel when markets crash.
The data below comes from BacktestIndia's 18.5-year simulation of the quality momentum strategy on NSE stocks. Hypothetical ₹50L starting capital in December 2006. Here is the exact portfolio value at each key moment:
⚠️ The psychological trap nobody warns you about
Notice what happened in July 2008: the portfolio recovered to ₹51.55L — above the ₹50L starting point. If you were watching your portfolio that month, you'd have felt relief. The bleeding had stopped. Then Lehman Brothers collapsed in September, and within 10 weeks the portfolio was at ₹28.98L — down ₹21L from that brief recovery. This is where most real investors sell. The ones who held through it reached ₹10.56 Cr by 2025. The ones who sold in October 2008 locked in a ₹21L loss and missed the entire recovery.
This is what makes momentum investing in India so hard to hold in practice — and it's something no percentage chart can fully communicate. A -42% drawdown feels very different from "your ₹50L became ₹28.98L, and you need markets to rise +84% just to get back to where you started."
The Survivability Data: Can a Real Investor Hold Through This?
Before deciding whether to research momentum further, here are three numbers that tell you whether you could actually hold through a crash:
The 89% figure is encouraging — in 200 of 224 months, your portfolio was worth more than you started with. But the 18 consecutive months below start, and the +84% gain needed to recover from the trough — those are the numbers that test whether you can stay invested when everything around you says sell.
Nobody can tell you in advance whether you'd hold through this — but now you have the real numbers to decide. You should know the actual rupee experience our simulation data shows, not the abstract percentage drawdowns. For comparison with a lower-drawdown simulation that recovered from the 2008 crash in just 7 months, see our low volatility factor backtest.
What Momentum Investing Actually Costs in India
Most articles show you gross CAGR. We show you net CAGR — after taxes and costs. Here is what that difference looks like in actual rupees over 18.5 years, from BacktestIndia's simulation on a hypothetical ₹50L portfolio.
The real tax bill on a ₹50L momentum portfolio over 18.5 years:
₹127.74L in taxes and ₹31.23L in transaction costs — ₹1.59 Cr total, more than 3× the original ₹50L investment. And the portfolio still grew to ₹5.70 Cr. Net gain after all costs: ₹5.20 Cr. That's what net CAGR means in real life — the taxman took ₹1.59 Cr, and you still came out ₹5.20 Cr ahead.
The tax burden grows with the portfolio. In 2007, you paid ₹40,620 in taxes and costs. In 2024, you paid ₹1.27 Cr — because the gains being taxed were themselves much larger. This is a feature, not a bug: the growing tax bill is evidence of growing wealth.
Why Annual Rebalancing Saves 0.44%/Year
The strategy in this simulation uses semi-annual rebalancing (every 6 months). If you switched to annual rebalancing, you would shift more trades into LTCG territory (12.5% tax) and out of STCG (20% tax), saving approximately 0.44% per year in tax drag. On a ₹50L portfolio over 18.5 years, that 0.44% compounds to roughly ₹76L in additional terminal wealth. See our full LTCG/STCG tax analysis for the complete breakdown.
What you need to implement this strategy yourself
- Minimum capital (in this simulation): ₹15–25L was used for meaningful 30-stock diversification at typical NSE prices. Actual requirements vary — below this, position sizes become too small for efficient execution.
- Time per rebalancing: ~2–3 hours every 6 months for stock selection and execution — or use the BacktestIndia tool to identify the stocks, then execute via your broker.
- Transaction costs: ~0.11% per trade (brokerage + STT + exchange charges + GST + DP fees). This is already included in all net CAGR figures above.
- Tax filing: Requires tracking LTCG vs STCG per trade. Recommended: maintain a trade log (your broker provides this) and share with a CA at year-end.
For the full implementation guide including broker comparison and step-by-step rebalancing process, see the How to Implement section below. For the passive alternative that requires no stock selection or rebalancing, see the Nifty 200 Momentum 30 ETF comparison.
What Is Momentum Investing? (India Context)
Momentum investing is the systematic strategy of buying stocks that have risen strongly over the past 6–12 months, on the premise that recent winners tend to keep winning — at least for a while. It is one of the most robust and academically documented market anomalies, studied across 200+ years of data by Jegadeesh and Titman (1993) and replicated in markets from the US to India.
The core logic: markets underreact to good news. When a company reports strong earnings, the stock rises — but investors are slow to fully reprice future cash flows. Momentum strategies exploit that lag, buying while the market catches up and selling before the trend reverses.
Why India Is Especially Fertile Ground for Momentum
- High retail participation (~40%): Retail investors underreact to news and tend to herd — classic ingredients for momentum. Compare to 20–25% retail participation on US exchanges.
- Faster-growing economy: Indian companies can sustain earnings momentum longer than peers in developed markets, giving trends more staying power before they fade.
- WhatsApp/Telegram pump groups: India's unique retail ecosystem creates stronger speculative signals — which makes the quality filter more powerful here than in developed markets.
📖 New to Factor Investing?
Momentum is one of five main factors — systematic return drivers backed by decades of academic research. For a full framework covering all five strategies tested on Indian data, see our Factor Investing India Complete Guide.
18-Year NSE Backtest: The Full Results
Methodology in Brief
- Universe: Top 200 NSE stocks by market cap at each rebalancing date
- Pure Momentum: Select 30 highest 12-month return stocks, equal-weight, semi-annual
- Quality Momentum: Top 60 by momentum → filter to 30 lowest Scaled Turnover
- Data: 1,700+ NSE-listed stocks including delisted names (sourced via EODHD · minimising survivorship bias)
- Costs: 0.11% transaction cost + 0.05% slippage per trade
- Taxes: Full LTCG/STCG treatment per Indian tax law (12.5% / 20%)
- Starting capital: Hypothetical ₹50 lakhs
⚠️ Simulation Disclaimer: Results represent historical simulation using hypothetical capital. Past performance does not predict future results. Not a recommendation to buy or sell any security.
Summary Performance Table (Dec 2006 – Jun 2025)
| Metric | Pure Momentum | Quality Momentum | Low Volatility | Nifty 50 |
|---|---|---|---|---|
| Gross CAGR | 15.23% | 19.47% | 12.85% | 10.42% |
| Net CAGR (after costs & tax) | 14.01% | 17.95% | 12.38% | 10.42% |
| Annual Volatility | 22.83% | 20.92% | 16.70% | 20.78% |
| Max Drawdown | -70.53% | -61.70% | -44.55% | -55.12% |
| Recovery (from 2008) | 65 months | 41 months | 7 months | 60 months |
| Sharpe Ratio | ~0.58 | 0.86 | ~0.74 | ~0.57 |
| Terminal Wealth (₹50L) | ₹5.64 Cr | ₹10.56 Cr | ₹4.32 Cr | ₹3.33 Cr |
Educational simulation. Hypothetical ₹50L capital. Past performance does not predict future results.
Where the Alpha Came From: Sector Concentration
Momentum is not sector-neutral. In BacktestIndia's 19-year simulation, three sectors drove the majority of outperformance — Industrials/Defence, Auto, and Infrastructure/Conglomerates. Understanding this concentration is essential before deploying the strategy.
| Sector | Relative Contribution Score | Key Holdings (Historical) |
|---|---|---|
| Industrials / Defence | 3.2 | HAL (score 2.65, held 5×) |
| Auto & EV | 2.8 | Eicher Motors (score 1.58, held 7×) |
| Infra & Conglomerates | 2.6 | Adani Enterprises (score 1.42, held 8×) |
| Metals & Steel | 2.1 | Jindal Stainless (score 1.04, held 3×) |
| Energy & Oil | 1.8 | Sector rotation dependent |
| Financials | 1.5 | Quality filter excluded speculative names |
| IT & Tech | 1.1 | Lower momentum in most regimes |
Historical simulation Dec 2006–Jun 2025. Contribution scores are relative wealth-creation metrics from the backtest — not return forecasts. Past sector performance does not predict future concentration. Educational data only.
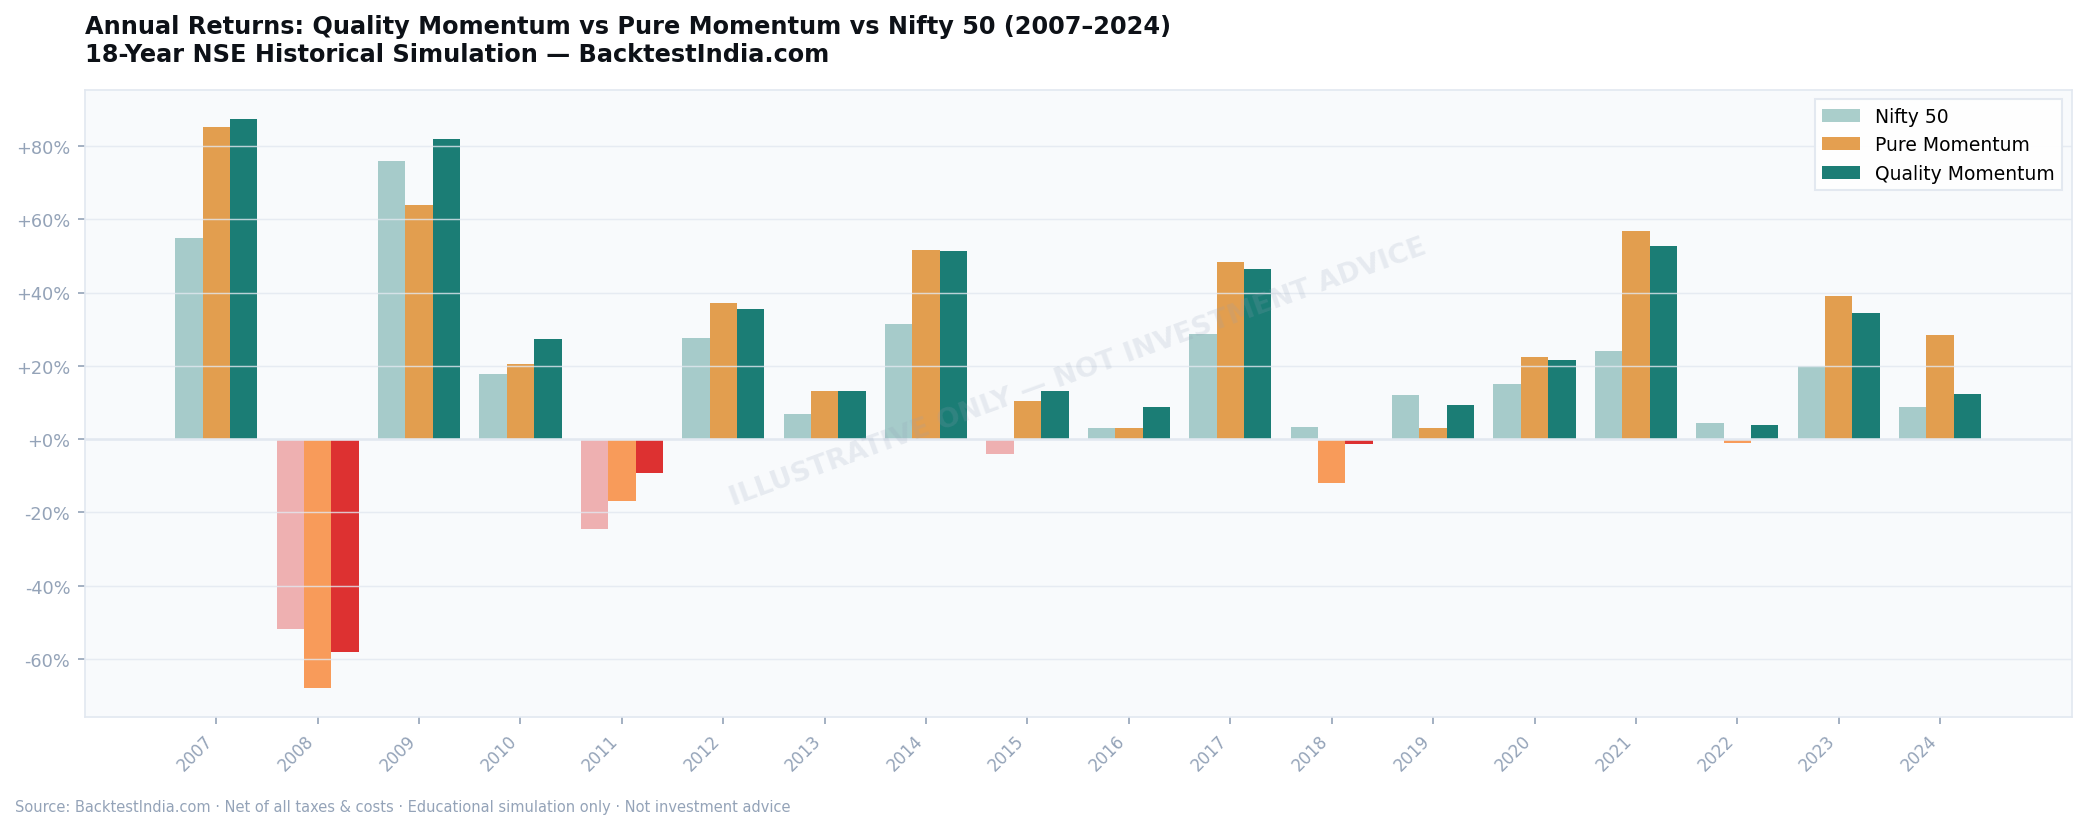
Year-by-Year Returns
| Year | Quality Momentum | Pure Momentum | Nifty 50 | QM vs Nifty |
|---|---|---|---|---|
| 2007 | +87.5% | +85.1% | +54.8% | +32.7% |
| 2008 | -58.2% | -68.0% | -51.8% | -6.4% |
| 2009 | +81.8% | +64.0% | +75.8% | +6% |
| 2010 | +27.4% | +20.6% | +17.9% | +9.5% |
| 2011 | -9.2% | -16.8% | -24.6% | +15.4% |
| 2012 | +35.4% | +37.1% | +27.7% | +7.7% |
| 2013 | +13.0% | +13.2% | +6.8% | +6.2% |
| 2014 | +51.2% | +51.7% | +31.4% | +19.8% |
| 2015 | +13.0% | +10.4% | -4.1% | +17.1% |
| 2016 | +8.8% | +3.0% | +3.0% | +5.8% |
| 2017 | +46.4% | +48.2% | +28.6% | +17.8% |
| 2018 | -1.3% | -11.9% | +3.2% | -4.5% |
| 2019 | +9.4% | +3.1% | +12.0% | -2.6% |
| 2020 | +21.6% | +22.5% | +14.9% | +6.7% |
| 2021 | +52.6% | +56.7% | +24.1% | +28.5% |
| 2022 | +3.8% | -1.0% | +4.3% | -0.5% |
| 2023 | +34.5% | +39.0% | +20.0% | +14.5% |
| 2024 | +12.2% | +28.4% | +8.8% | +3.4% |
| 2025 * | +0.8%* | -2.8%* | +5.0%* | -4.2% |
* 2025 partial: Jan–Jun for QM/PM; Jan–May for Nifty 50. All figures net of taxes and costs.
The Dark Side: Momentum's Brutal Drawdowns
The dirty secret of momentum investing in India is its drawdown profile. In the 2008 Global Financial Crisis, pure momentum didn't merely participate in the market's decline — it dramatically amplified it:
Educational simulation. 2008 crisis drawdowns. Past crisis performance does not predict future drawdowns.
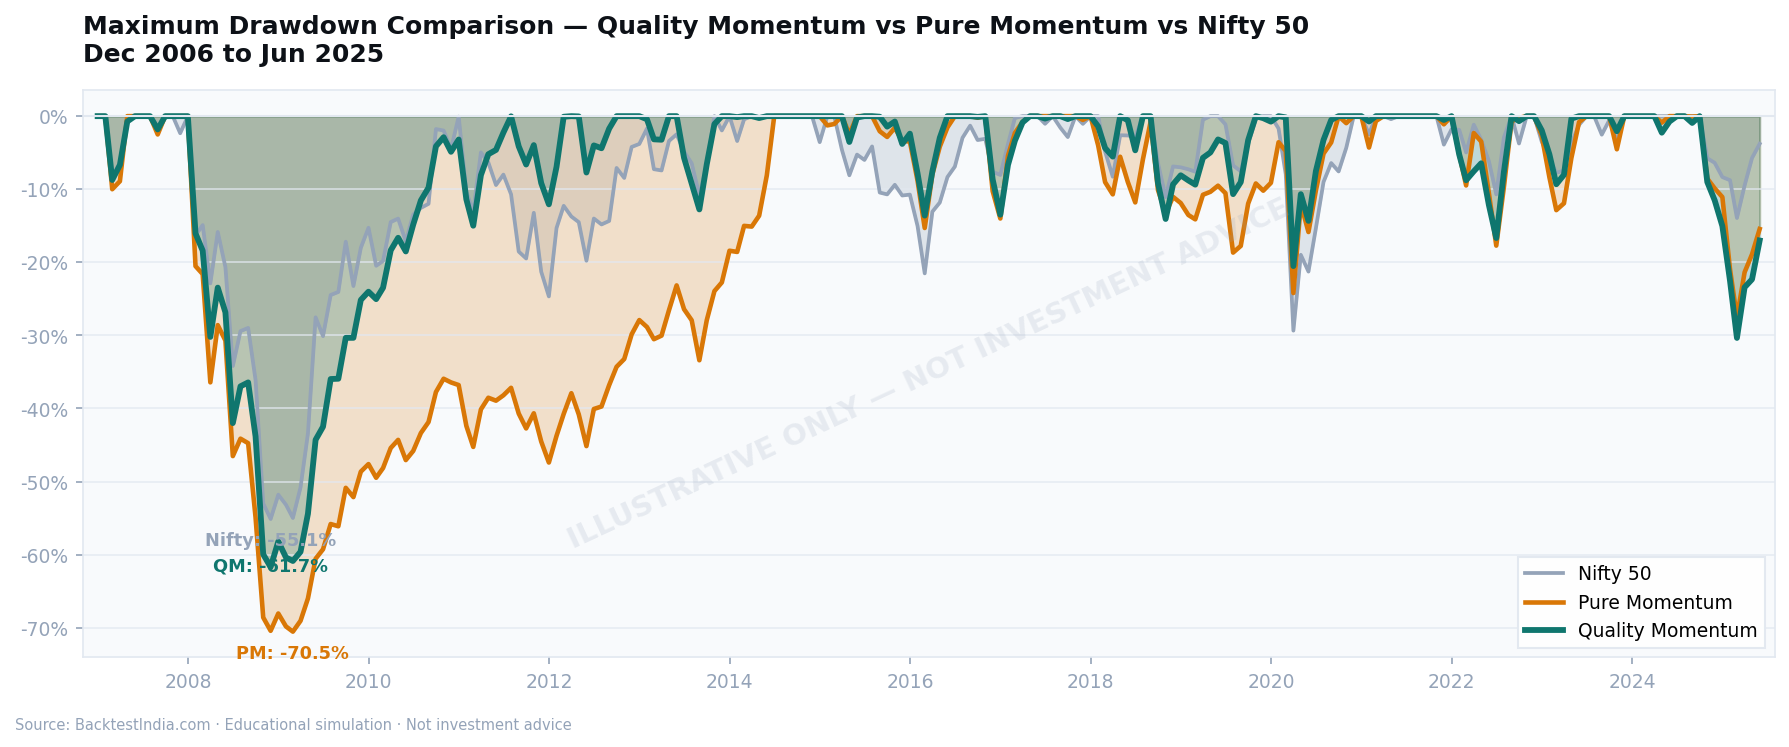
A -70.53% drawdown means a hypothetical ₹1 crore portfolio shrank to under ₹30 lakhs at the trough. Recovering from -70% requires a subsequent +233% gain just to break even. It then took 65 months — over five years — for pure momentum to crawl back. By contrast, Quality Momentum recovered in 41 months — and the Nifty 50 itself took 60 months.
The Psychological Trap of Momentum Drawdowns
Beyond the mathematics, -70% drawdowns create a behavioural trap that destroys real-world returns further than the numbers suggest. Most investors capitulate near the bottom — selling after a -50% decline, then watching the recovery from the sidelines. The quality filter — which reduces drawdowns from -70% to -62% — is genuinely valuable not just mathematically, but for real-world behavioural discipline.
The Fix: The Anti-Speculation Filter (Scaled Turnover)
Our research identified a data-driven way to separate genuine momentum from speculative froth: Scaled Turnover. This single metric — derived entirely from publicly available trading data — flagged multiple high-profile financial companies as dangerous 12–24 months before they experienced 95–99% crashes.
📐 The Scaled Turnover Formula (Educational Methodology)
What it measures: The percentage of a company's total market value that changes hands each month. This ratio reveals the intensity of trading relative to company size.
- Low (5–10% monthly): Patient institutional ownership. Stock rises on fundamental business performance. This is the momentum we want.
- High (40–60% monthly): Retail speculation, operator activity, pump-and-dump. The entire float churns every 1–2 months. When sentiment reverses, the collapse is catastrophic.
⚠️ Research methodology only. Not implementation guidance. Consult SEBI-registered adviser before deploying real capital. Find SEBI-RIA →
Why Scaled Turnover Works Especially Well in India
- ~40% retail participation vs 20–25% in the US/Europe — more speculative activity leaves stronger signals
- WhatsApp/Telegram pump groups at scale — coordinated buying creates detectable turnover spikes
- Operator-driven stocks — circular trading creates artificial momentum with characteristic patterns
- Negative correlation with momentum (~-0.17): High-momentum stocks in the NSE universe tend to have higher turnover on average — meaning the filter genuinely differentiates rather than just replicating momentum selection
💡 Academic context: Lee & Swaminathan (2000) in the Journal of Finance documented that low-volume momentum winners outperformed high-volume winners by 1.5% monthly in the US. Hou, Xiong & Peng (2009) found high-turnover stocks in China's retail-heavy market crashed harder during corrections — patterns mirroring our Indian findings. Educational references only.
Real Proof: How the Filter Identified Corporate Failures Early
Theory only convinces when it survives contact with reality. Two of India's most dramatic financial collapses both exhibited textbook high-turnover warning signals well before their catastrophic declines.
📉 Case Study 1: Major Housing Finance Company — -99% Collapse (2018–2019)
A major housing finance company was among India's top three by market share. From 2015–2018, it rose from ₹200 to ₹665 — a 232% gain that qualified it for any momentum portfolio. Pure momentum strategies held it throughout.
What Scaled Turnover saw (2017–2018):
| Company | Monthly Scaled Turnover | Signal |
|---|---|---|
| Housing Finance Co. A (Failed) | 40–60% | 🚨 Extreme Speculation |
| Large Housing Finance Co. B (quality peer) | 5–8% | ✅ Patient Institutional |
| Strategy | Signal Seen | Action | Outcome |
|---|---|---|---|
| Pure Momentum | Price rising ✓ | HOLD | Crashed with stock (-99%) |
| Quality Momentum | Turnover 40–60% ✗ | EXCLUDE | Avoided -99% wipeout |
The crash: The company fell from ₹665 to ₹7 — a -99% loss — between September 2018 and August 2019. The company entered insolvency in November 2019.
Educational case study based on publicly available trading data. Past patterns do not guarantee future identification of similar situations.
📉 Case Study 2: Mid-Sized Private Bank — -96% Collapse (2018–2020)
A mid-sized private bank was among India's top five by market cap at peak (₹65,000+ Cr). It had risen 304% from 2016–2018, making it a strong momentum candidate.
What Scaled Turnover saw (2018–2019):
| Bank | Monthly Scaled Turnover | Signal |
|---|---|---|
| Large Private Bank A | 5–8% | ✅ Patient Institutional |
| Mid-Size Private Bank B | 6–10% | ✅ Patient Institutional |
| Private Bank C (Failed) | 30–40% | 🚨 3–4× Higher Than Peers |
The crash: The bank fell from ₹404 to ₹16 — a -96% loss — between August 2018 and March 2020. RBI placed the bank under moratorium.
Educational case study. Warning signal appeared 18+ months before the crash. Not predictive; many factors contributed to this collapse beyond turnover patterns.
Pattern Across Both Cases
- Both rose 200–300% before the crash — strong momentum candidates on price alone
- Both showed 30–60% monthly turnover vs quality peers at 5–10%
- Both crashed 95–99% — validating the severity of the speculation signal
- Warning appeared 12–24 months early — ample time for semi-annual rebalancing to exclude them
- No fundamental analysis required — purely public trading data
Quality Momentum: Higher Returns, Lower Risk Simultaneously
Adding the Scaled Turnover filter produced a result that appears to violate classical finance theory — both returns improved and risk declined simultaneously. The explanation is behavioural: speculative stocks provide temporary gains but then create the worst crash outcomes. Removing them improves both sides of the ledger.
Head-to-Head: Quality vs Pure Momentum
| Metric | Quality Momentum | Pure Momentum | Improvement |
|---|---|---|---|
| Net CAGR | 17.95% | 14.01% | +3.94% per year |
| Annual Volatility | 20.92% | 22.83% | 8% lower |
| Max Drawdown | -61.70% | -70.53% | 13pp shallower |
| Recovery (2008) | 41 months | 65 months | 37% faster |
| Sharpe Ratio | 0.86 | ~0.58 | +48% |
| Terminal Wealth (₹50L) | ₹10.56 Cr | ₹5.64 Cr | +₹4.92 Cr (+87%) |
| 3-yr Worst CAGR | -1.1% | -14.2% | 13pp better floor |
| 3-yr Positive Periods | 99% | 91% | 8pp more consistent |
The Compounding Wealth Gap Over Time (₹50L Start)
| Milestone | Quality Momentum | Pure Momentum | Cumulative Gap |
|---|---|---|---|
| Year 5 (Dec 2011) | ₹0.82 Cr | ₹0.49 Cr | +₹34 lakhs |
| Year 10 (Dec 2016) | ₹2.34 Cr | ₹1.30 Cr | +₹1.04 Cr |
| Year 15 (Dec 2021) | ₹6.87 Cr | ₹3.37 Cr | +₹3.50 Cr |
| Year 18.5 (Jun 2025) | ₹10.56 Cr | ₹5.64 Cr | +₹4.92 Cr |
The gap accelerated dramatically in later years — ₹34 lakhs after year 5 became ₹4.92 crores after year 18.5. This is compounding at work: a 3.94% annual difference snowballs into an enormous terminal wealth advantage.
Historical simulation. Actual outcomes would differ due to execution, behavioural factors, and market conditions not fully captured in backtests.
Nifty 200 Momentum 30 Index: Construction and Key Differences
NSE's Nifty 200 Momentum 30 Index, launched in 2020, made momentum factor investing accessible through low-cost ETFs (Nippon India ETF Nifty200 Momentum 30 and similar products). It is well-constructed — but structural differences from Quality Momentum are worth understanding:
| Feature | Nifty 200 Momentum 30 | Quality Momentum (BacktestIndia) |
|---|---|---|
| Momentum signal | 6M + 12M normalised return | 12M normalised momentum |
| Quality filter | None | Scaled Turnover — lower = patient capital |
| Weighting | Market-cap weighted | Equal weight · 3.33% per stock |
| Rebalancing | Semi-annual (Jan & Jul) | Semi-annual (Jun & Dec) |
| Loss-maker filter | None | PE > 0 removes loss-making companies |
| Max concentration | ~5–10% per stock | 3.33% hard cap |
| Survivorship bias | Current Nifty 200 members only | 1,700+ stocks incl. all delisted names |
The two most consequential differences: equal weighting prevents single-stock concentration risk, and the absence of a quality filter in the index is the primary source of the simulated CAGR gap.
The numbers in the table above are the theoretical gap — this video shows why it exists in practice: why popular Nifty 200 Momentum 30 ETFs deliver only 8.51% CAGR in liquid stocks despite their headline returns, and how the scaled-turnover filter captures the alpha they leave behind.
All 9 Market Regimes: Does Momentum Only Work in Bull Markets?
The most common critique of momentum: it only works in bull markets and collapses in downturns. The regime-by-regime breakdown below tests both strategies across every distinct historical period from the 2008 GFC through the 2023 rate hike cycle:
| Regime | Period | QM CAGR | PM CAGR | Nifty CAGR | QM vs Nifty |
|---|---|---|---|---|---|
| 2008 Financial Crisis | Jan 2008–Mar 2009 | -37.0% | -53.8% | -38.6% | +1.6% |
| Post-GFC Recovery | Apr 2009–Oct 2011 | +27.7% | +77.2% | +11.8% | +15.9% |
| 2011–13 Slowdown | Jun 2011–Dec 2013 | +14.2% | +14.5% | +12.5% | +1.7% |
| Modi Reform Era | Jan 2014–Dec 2016 | +26.0% | +28.5% | +14.2% | +11.8% |
| Demonetisation & GST | Jan 2016–Dec 2017 | +20.0% | +27.1% | +19.9% | +0.1% |
| Pre-COVID Slowdown | Jan 2018–Dec 2019 | +5.5% | -0.7% | +5.0% | +0.5% |
| COVID Crisis & Recovery | Jan 2020–Dec 2020 | +24.0% | +19.5% | +16.7% | +7.3% |
| Post-COVID Rally | Jan 2021–Dec 2022 | +24.0% | +32.1% | +20.8% | +3.2% |
| Rate Hike Cycle | Jan 2023–Dec 2023 | +31.5% | +43.2% | +22.1% | +9.4% |
Historical regime analysis. Market conditions change. Past outperformance in specific regimes does not guarantee similar future performance.
Portfolio Characteristics: PE Profile and EPS Growth
Comparing the PE ratio and EPS growth profiles of both strategies versus the NSE universe explains why they perform differently — and validates that the Scaled Turnover filter is doing genuine quality work, not just mechanical screening.
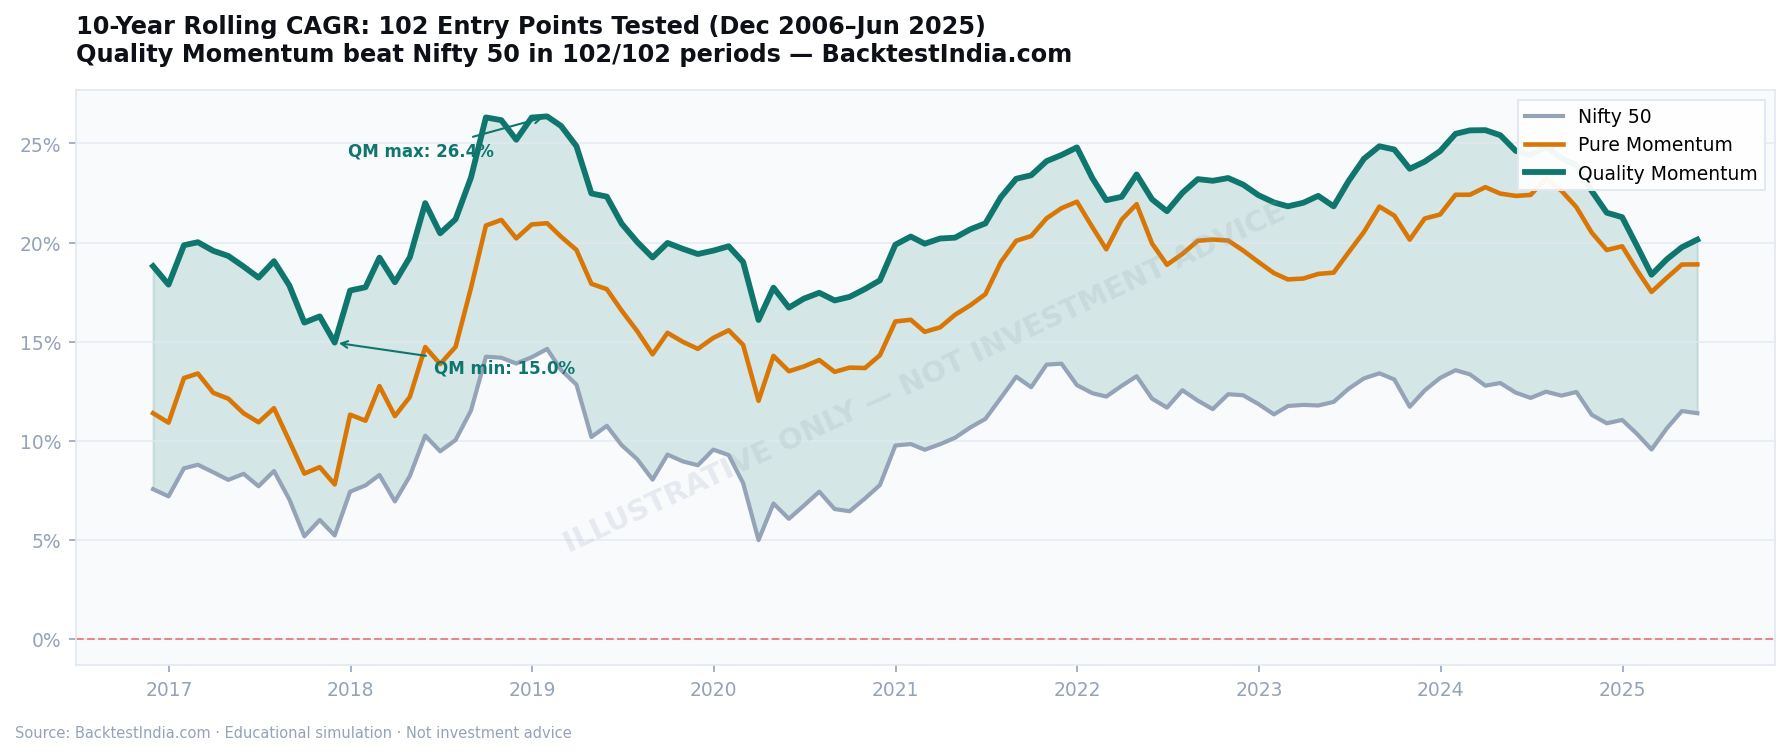
10-Year Rolling Returns: What If You Started at the Worst Time?
Single-period CAGR can hide extended underperformance windows. The rolling return test asks: regardless of when an investor entered, did the strategy reliably outperform? We tested 102 different 10-year entry points across the full dataset.
| 10-Year Window | QM CAGR | Nifty CAGR | Outperformance |
|---|---|---|---|
| Dec 2006 → Dec 2016 | +18.4% | +7.5% | +10.9% |
| Dec 2007 → Dec 2017 | +17.9% | +7.0% | +10.9% |
| Jun 2009 → Jun 2019 | +22.1% | +10.8% | +11.3% |
| Dec 2011 → Dec 2021 | +24.6% | +12.9% | +11.7% |
| Jun 2014 → Jun 2024 | +24.7% | +12.5% | +12.2% |
| Dec 2014 → Dec 2024 | +21.3% | +11.1% | +10.2% |
| May 2015 → May 2025 | +20.1% | +11.4% | +8.7% |
For detailed worst-case rolling return scenarios, see our India Lost Decade rolling returns study.
6-Month and 3-Year Return Distribution
Rolling 10-year data shows consistency at the long end — but what about shorter holding periods? BacktestIndia's simulation across all 38 semi-annual rebalancing events shows a right-skewed distribution with more frequent positive outcomes than negative.
The 91% positive 3-year figure is the most practically useful number here — it means that in this simulation, an investor who held for any 3-year window had a 91% probability of a positive outcome regardless of entry timing. The 9% negative windows all cluster around the 2008 crisis entry points. Educational simulation only — past distribution does not predict future returns.
Tax Reality: LTCG vs STCG and the 0.44%/Year Advantage
Indian tax law creates a meaningful wedge between gross and net returns. Getting this right adds nearly 0.5% per year — which compounds to lakhs over a decade.
The Tax Framework
- LTCG: 12.5% on gains above ₹1.25 lakh annually, for holdings held over 12 months
- STCG: 20% for holdings sold within 12 months
The difference between quarterly and annual rebalancing is not a rounding error — it is roughly ₹76L in terminal wealth on a ₹50L portfolio over 18.5 years. Here is why:
| Rebalancing Frequency | Typical LTCG % | Typical STCG % | Annual Tax Drag |
|---|---|---|---|
| Quarterly | ~20% | ~80% | ~1.8% |
| Semi-Annual (this backtest) | ~50% | ~50% | ~1.5% |
| Annual | ~80% | ~20% | ~1.06% |
Annual rebalancing historically saved approximately 0.44% per year in tax drag vs semi-annual in our simulation. The 17.95% figure in this article uses semi-annual; the annual equivalent is approximately 18.39%.
Full analysis: LTCG/STCG Tax-Aware Factor Investing India →
⚠️ Tax disclaimer: Educational estimates from simulation modelling. Actual tax liability depends on individual income, existing LTCG exemption usage, and applicable rules. Consult a chartered accountant for personal tax planning.
How to Implement Momentum Investing in India
⚠️ READ BEFORE PROCEEDING
The following describes systematic methodologies for educational understanding — NOT personalised implementation guidance. Quality momentum strategies showed -61.70% maximum drawdowns in historical simulation. Before deploying real capital, consult a SEBI-registered Investment Adviser →
🔬 Explore the Methodology Yourself
BacktestIndia's free educational platform lets you test quality momentum with custom parameters — different universes, lookback periods, turnover thresholds. 18+ years of NSE data with automatic LTCG/STCG modelling.
Access Educational Backtester →Educational research tool only · Not investment advice · Consult SEBI-RIA before investing with real capital
Frequently Asked Questions
⚠️ FAQ disclaimer: Educational information only. BacktestIndia.com is not a SEBI-registered Investment Adviser. Consult qualified professionals before making investment decisions.
Momentum investing is a systematic strategy that buys the top-performing NSE stocks every 6–12 months, based on the principle that recent winners tend to keep winning. In BacktestIndia's 18.5-year simulation, quality momentum delivered 17.95% net CAGR vs Nifty 50's 10.42%, but with severe -62% drawdowns. Educational simulation only — not investment advice.
In BacktestIndia's 18.5-year NSE simulation (Dec 2006–Jun 2025), quality momentum delivered 17.95% net CAGR vs Nifty 50's 10.42% — but pure momentum suffered a -70.53% maximum drawdown with 65-month recovery. Profitability depends entirely on whether you can hold through those drawdowns. Past performance does not guarantee future results — consult a SEBI-registered adviser.
The main risk is severe, prolonged drawdowns: a ₹50L quality momentum portfolio fell to ₹27.19L at the February 2009 trough — 18 consecutive months below the starting amount. Pure momentum was worse at -70.53% maximum drawdown, requiring +233% just to break even. This is not a strategy for investors with low risk tolerance or short time horizons.
Combining 12-month price momentum with a scaled-turnover anti-speculation filter (Quality Momentum) delivered 17.95% net CAGR with -61.70% drawdown in BacktestIndia's 18.5-year simulation — outperforming pure momentum on both returns and risk. It beat the Nifty in all 9 historical market regimes tested. Educational research — not a recommendation.
Momentum strategies amplify crashes: pure momentum fell -70.53% in 2008 (worse than Nifty 50's -55%) and took 65 months to recover. Quality momentum was less severe at -61.70% with 41-month recovery — faster than the Nifty's own 60-month recovery. Neither is a defensive strategy.
The most effective momentum filter for Indian stocks in BacktestIndia's 18.5-year simulation is Scaled Turnover — calculated as (Trading Volume × Stock Price) ÷ Market Capitalisation. Stocks with low monthly scaled turnover (5–10%) show patient institutional ownership and genuine earnings momentum. Stocks with high turnover (30–60%) signal retail speculation — this filter excluded major housing finance and mid-sized private bank collapses 12–24 months before their 95–99% crashes. Educational research only — not a recommendation.
Scaled Turnover = (Trading Volume × Stock Price) ÷ Market Capitalisation — it measures what percentage of a company's value trades each month. Low values (5–10%) indicate patient institutional ownership; high values (40–60%) signal speculation, and flagged major housing finance and mid-sized private bank collapses 12–24 months before their 95–99% crashes. Educational metric only.
Nifty 200 Momentum 30 ETFs track pure momentum without a quality filter, are market-cap weighted, and include speculative stocks. BacktestIndia's quality momentum simulation added ~3.94% annual CAGR over pure momentum with shallower drawdowns, but requires significantly higher implementation complexity. Educational comparison only — verify fund details with the AMC.
Semi-annual rebalancing generates a mix of LTCG (12.5% above ₹1.25L) and STCG (20%), totalling ₹127.74L in taxes on a simulated ₹50L portfolio over 18.5 years. Annual rebalancing saves approximately 0.44% per year by shifting more trades into LTCG territory. Consult a chartered accountant for your personal situation.
Both showed positive results with very different risk profiles: pure momentum (see our base momentum backtest) delivered 14.01% CAGR with -70.53% drawdown, while value-quality recovered from 2008 in just 7 months vs 65 months for momentum. Many investors combine both via multi-factor approaches — see our multi-factor investing backtest for the combined strategy simulation.
Stop-losses generally conflict with systematic momentum rebalancing: the strategy already has a built-in exit mechanism — the semi-annual rebalance replaces stocks that have lost momentum with new leaders. Adding a discretionary stop-loss introduces timing decisions that historical data shows most investors get wrong, typically selling at troughs and missing the recovery that follows. For investors who cannot stomach a -61% drawdown without a stop-loss, the low volatility strategy (-44% max drawdown, 7-month recovery) may be a better structural fit.
In BacktestIndia's 18.5-year simulation, quality momentum delivered 17.95% net CAGR vs a Nifty 50 index fund equivalent of 10.42% — a 7.53% annual gap that compounded a hypothetical ₹50L into ₹10.56 Cr vs ₹3.33 Cr. However, momentum required holding through a -61.70% drawdown and 41-month recovery, while a Nifty index fund is passive, low-cost, and behaviorally far easier to hold. The right choice depends entirely on your risk tolerance and behavioural discipline — not the return numbers alone. Educational comparison only — not a recommendation.
Methodology & Data Sources
Simulation Parameters
- Coverage period: December 2006 – June 2025 (18.5 years)
- Universe: Top 200 NSE stocks by market cap at each rebalancing date
- Dataset: 1,700+ NSE-listed stocks including delisted companies (sourced via EODHD) — minimising survivorship bias
- Pure Momentum: Select 30 highest 12-month return stocks · equal-weight · semi-annual rebalancing
- Quality Momentum: Select 60 highest momentum → filter to 30 lowest Scaled Turnover · same rebalancing
- Transaction costs: 0.11% per trade (brokerage + STT + exchange charges + GST + DP fees)
- Slippage: 0.05% per trade
- Tax: LTCG 12.5% on gains >₹1.25L annually (holdings >12 months) · STCG 20% per 2024 Indian law
- Starting capital: Hypothetical ₹50 lakhs
- Dividend treatment: Price return only (ex-dividend) — dividends excluded as standard backtesting practice
- Academic guidance: Mayank Joshipura, PhD — Vice Dean-Research & Professor of Finance, NMIMS University
- Copyright: © 2026 T. Desai · BacktestIndia.com · Copyright Certificate No. SW-2025021891
BacktestIndia.com has no direct affiliation with NSE, BSE, SEBI, or any exchange, regulatory body, brokerage, mutual fund company, or financial institution. All company and exchange names are used for educational reference only.
📎 How to Cite This Research
Desai, T. (2026). Momentum Investing India: Complete Guide — What It Is, the Real Risks, and 18 Years of NSE Data. BacktestIndia.com. Published December 28, 2025; updated March 18, 2026. https://backtestindia.com/blog/quality-momentum-india-backtest. Copyright Certificate No. SW-2025021891.
Academic guidance: Mayank Joshipura, PhD — Vice Dean-Research & Professor of Finance, NMIMS University. Dataset: NSE-listed equity data sourced via EODHD, December 2006 – June 2025, 1,700+ stocks including delisted names. © 2026 T. Desai · BacktestIndia.com · All rights reserved.
Key Takeaways
- Momentum works in India — 14.01% net CAGR over 18.5 years vs Nifty 50's 10.42%. The academic anomaly is real and persistent in this simulation.
- But the drawdowns are brutal — -70.53% in 2008, 65 months to recover. A ₹50L portfolio fell to ₹27.19L at the trough. This is a strategy for investors with high risk tolerance, long time horizons, and exceptional behavioural discipline.
- The anti-speculation filter is the key upgrade — Scaled Turnover separates genuine institutional momentum from retail speculation. Adding it raised CAGR to 17.95%, cut drawdowns to -61.70%, recovery to 41 months.
- Both returns and risk improved simultaneously — because speculation-driven stocks create the worst crash outcomes. Removing them benefits both sides of the ledger.
- Quality Momentum beat Nifty in all 9 regimes — including the 2008 GFC. Pure Momentum underperformed in 2 of 9. The quality filter works across market conditions, not just in bull markets.
- Recovery from 2008 was faster than the Nifty itself — 41 months vs 60 months. A strategy with higher long-run CAGR also historically protected capital better during the worst crash in modern Indian market history.
- The real cost is high but the gains are higher — ₹127.74L in taxes + ₹31.23L in transaction costs over 18.5 years, on a ₹50L investment that grew to ₹5.70 Cr.
- Tax-aware rebalancing adds ~0.44%/year — annual rebalancing maximises LTCG treatment.
- This is not a low-risk strategy — even quality momentum had -62% drawdowns. Conservative investors should consider low volatility (12.38% CAGR, -44% drawdown, 7-month recovery) or multi-factor strategies instead.
📚 Complete Your Factor Investing Education
⚠️ COMPREHENSIVE EDUCATIONAL DISCLAIMER
EDUCATIONAL RESEARCH ONLY — NOT INVESTMENT ADVICE: This analysis presents hypothetical simulation using historical NSE-listed equity data sourced via EODHD. BacktestIndia.com is an educational research platform. Nothing on this page constitutes a solicitation to buy or sell any security or personalised investment advice.
NO WARRANTIES — PAST PERFORMANCE: Past simulation results do not predict or guarantee future returns. Historical backtests are hypothetical and do not reflect real-world execution limitations, psychological discipline requirements, market impact, or changing market conditions.
MANDATORY PROFESSIONAL CONSULTATION: Before implementing any strategy with real capital, consult a SEBI-registered Investment Adviser → and a chartered accountant for tax advice.
NO AFFILIATION: BacktestIndia.com has no direct affiliation with NSE, BSE, SEBI, or any financial institution. All exchange and company names used for educational reference only.
INTELLECTUAL PROPERTY: © 2026 T. Desai. All content, methodology, and analysis proprietary to BacktestIndia.com. Copyright Certificate No. SW-2025021891. Unauthorised reproduction prohibited.
About This Analysis
- Author: T. Desai · BacktestIndia.com
- Data: NSE-listed equity data via EODHD · Dec 2006 – Jun 2025 · 1,700+ stocks
- Published: December 28, 2025 · Last Updated: March 18, 2026
- Academic guidance: Mayank Joshipura, PhD — Vice Dean-Research, NMIMS University
- Contact: backtestindia@gmail.com
Test this strategy yourself
Hidden Gems
We've pre-configured this exact strategy in our backtesting tool. One tap to load it, one tap to run it on 19 years of real NSE data. Your first backtest is free.
Educational tool — not investment advice. You choose to explore this strategy. Past performance ≠ future results.