Latest Articles17 Articles
📘 Guides
3 articlesTool walkthroughs, engine deep-dives, and start-here reads for systematic factor investing on NSE.
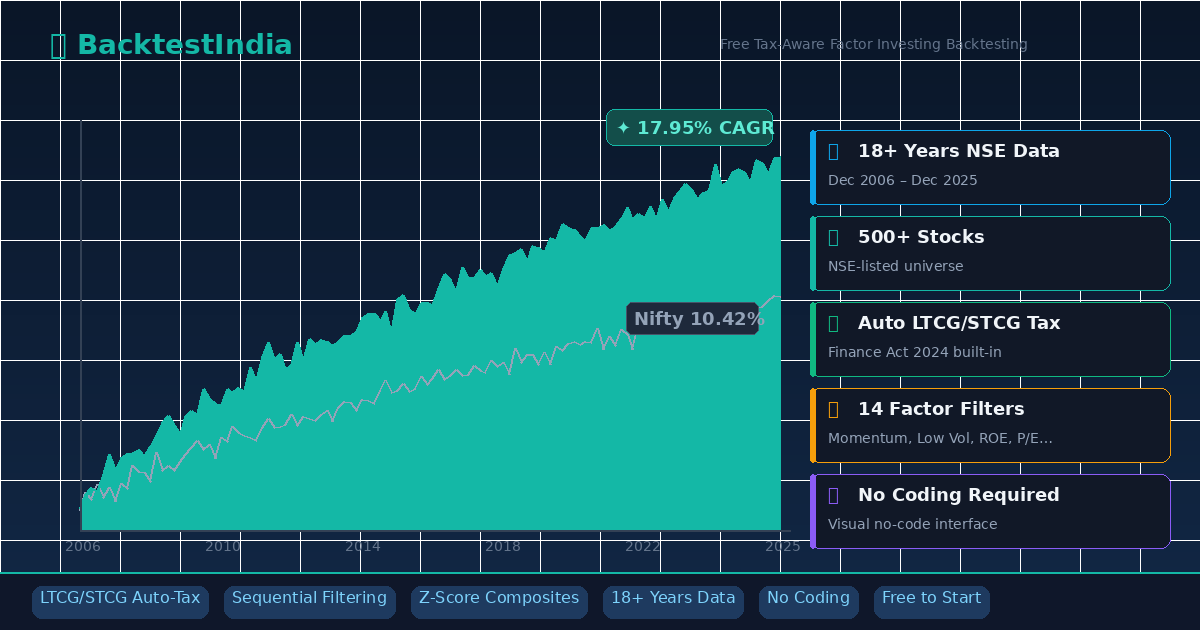
BacktestIndia: Free Tax-Aware Backtesting Tool for Factor Investing on NSE Stocks (18+ Years Data)
BacktestIndia is India's only backtesting platform with automatic LTCG/STCG tax calculations. Test momentum, low volatility, quality, and value factor strategies on 18+ years of NSE data covering 1,700+ stocks — including delisted companies. No coding required. Start free with 10 backtests per month.
See also: Advanced Engine Deep-Dive · Factor Investing Guide
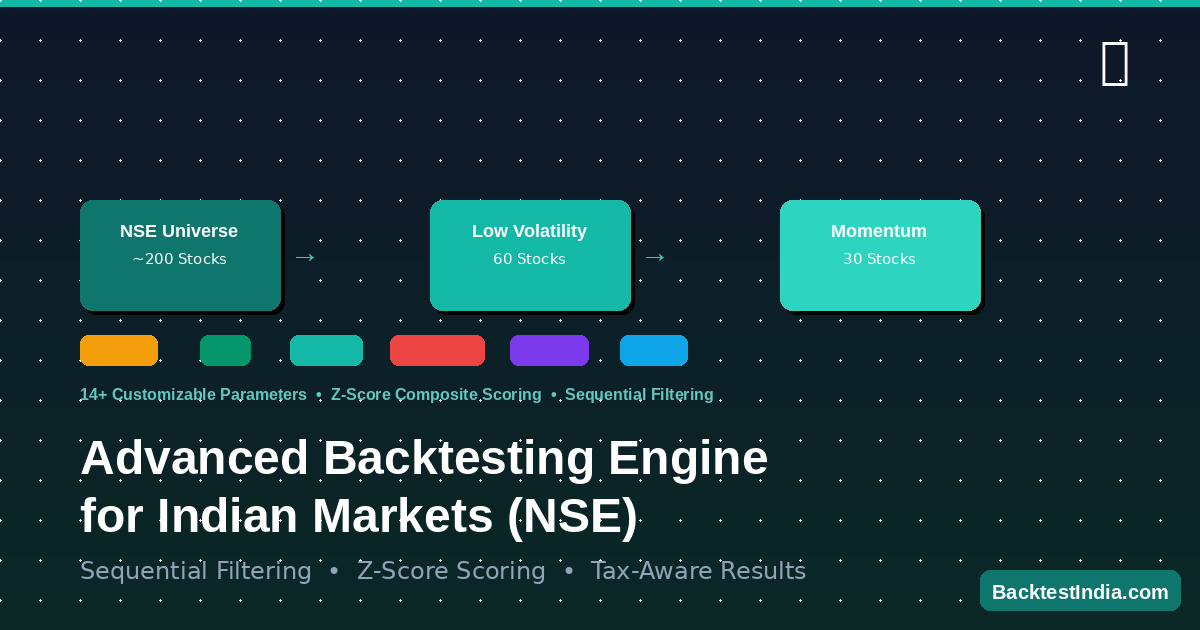
Advanced Backtesting Engine: Sequential Filtering, Z-Score Scoring, 14 Parameters on NSE
Full breakdown of BacktestIndia's engine: sequential filtering (60 low-vol → 30 momentum), Z-score mixing (momentum + low PE + ROE), 14 parameters, NSE tax-accurate results. Educational deep-dive.
See also: Tool Guide · Quality-Momentum Methodology
📊 Backtests
5 articles18-year NSE backtests across Low Volatility, Momentum, Quality-Momentum, Multi-Factor, and Value-Quality strategies vs Nifty 50 benchmark.
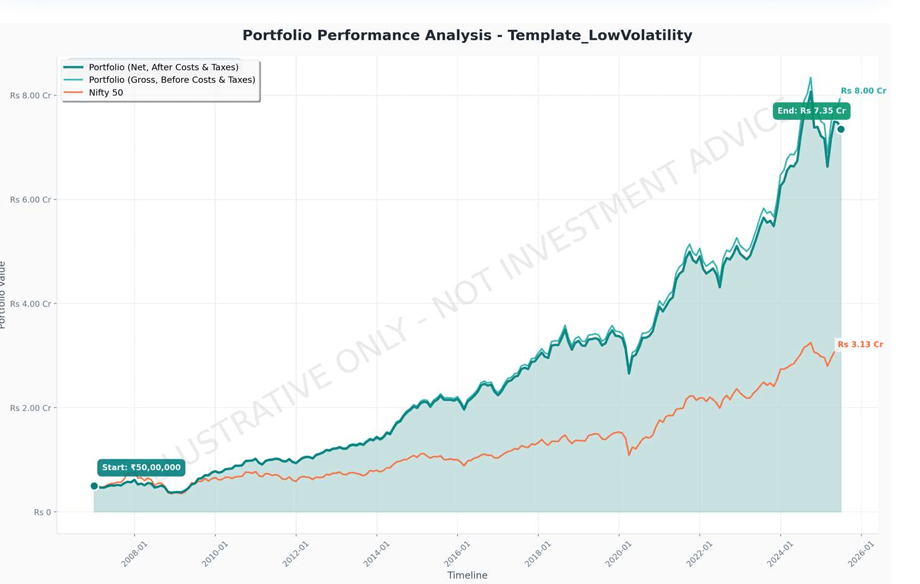
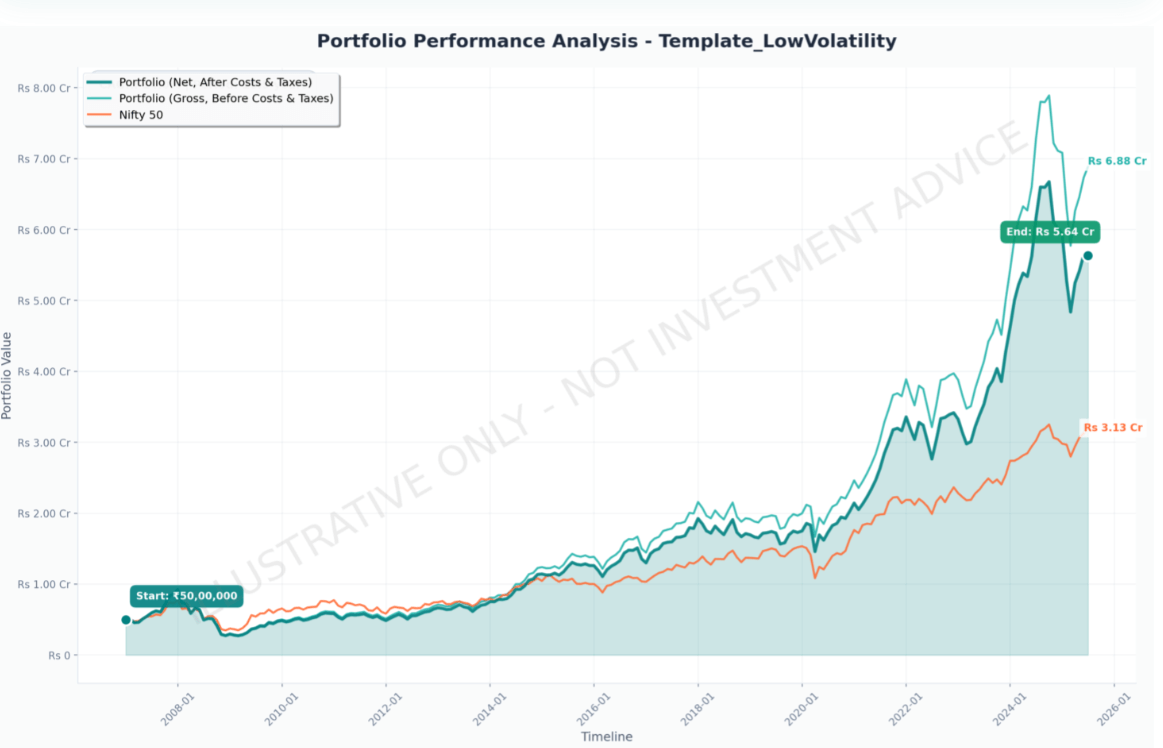
Does Low Volatility Outperform in India? 18-Year NSE Backtest
Low volatility factor screen historical simulation results vs Nifty 50 benchmark (Dec 2006–Dec 2025). Educational data only.
See also: Rolling Returns: Historical Consistency Study · Multi-Factor Blend
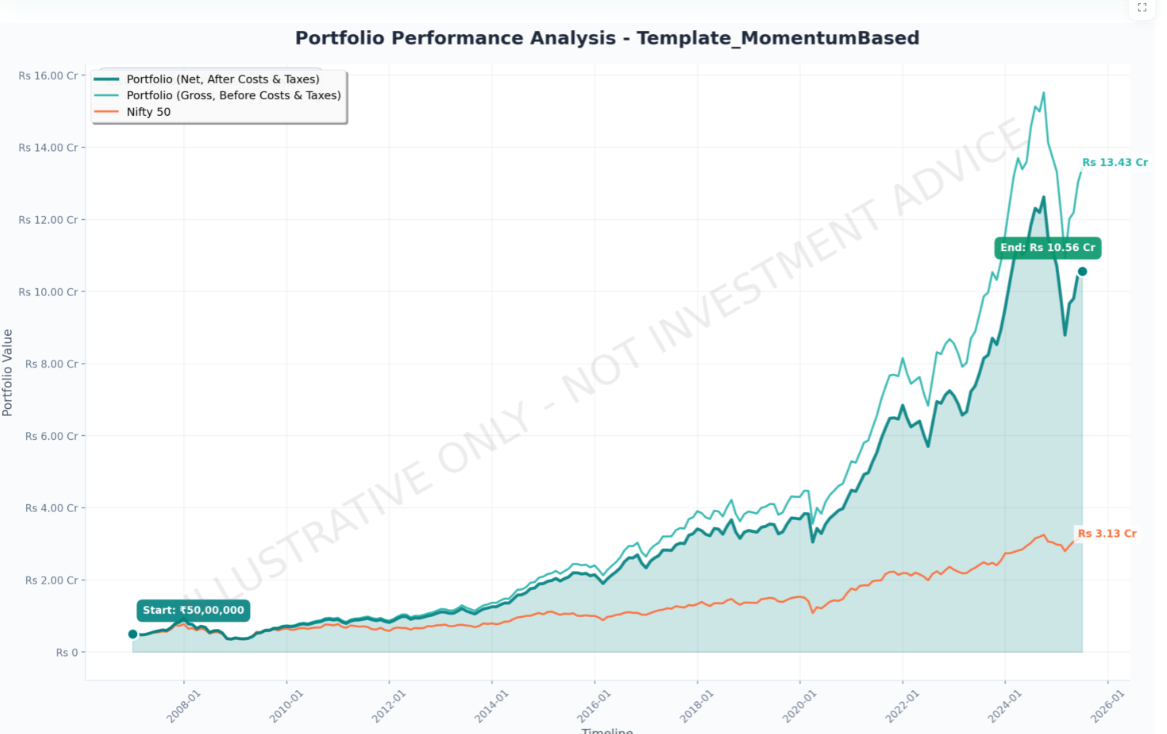
Momentum Investing India: 18-Year NSE Backtest
14.01% CAGR with brutal -70% drawdowns. Complete tax-aware analysis for aggressive investors.
See also: Quality-Momentum Upgrade · Liquidity Premium Research
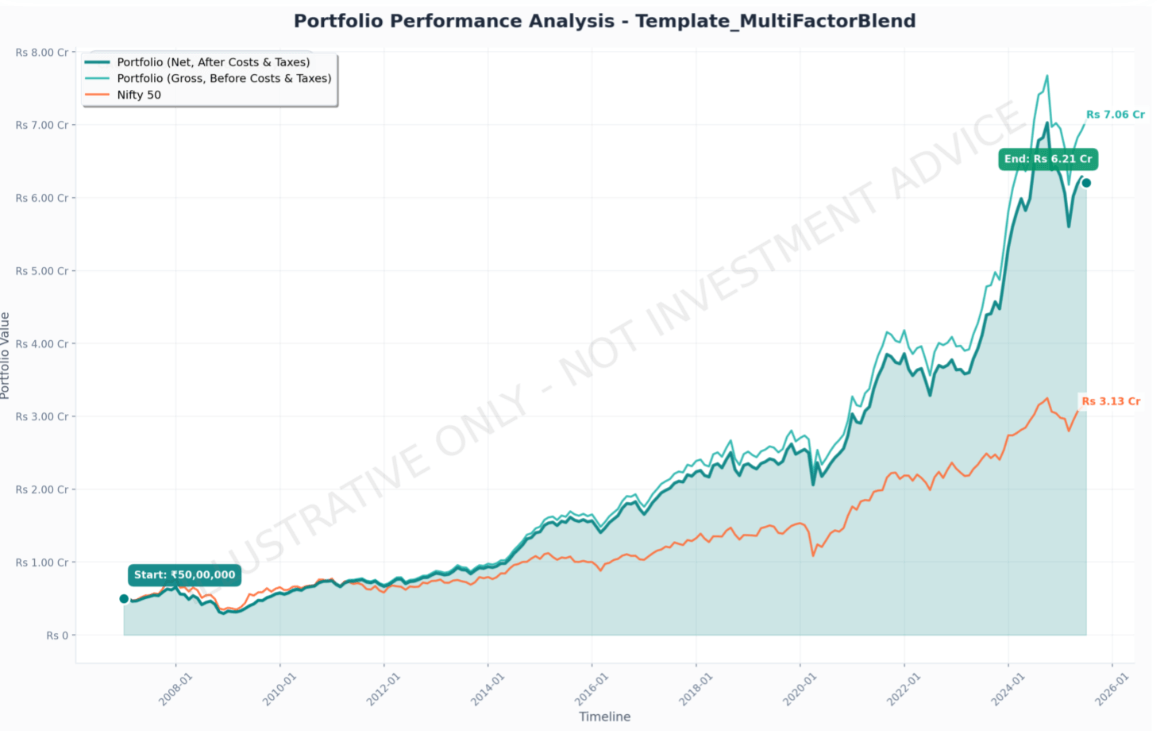
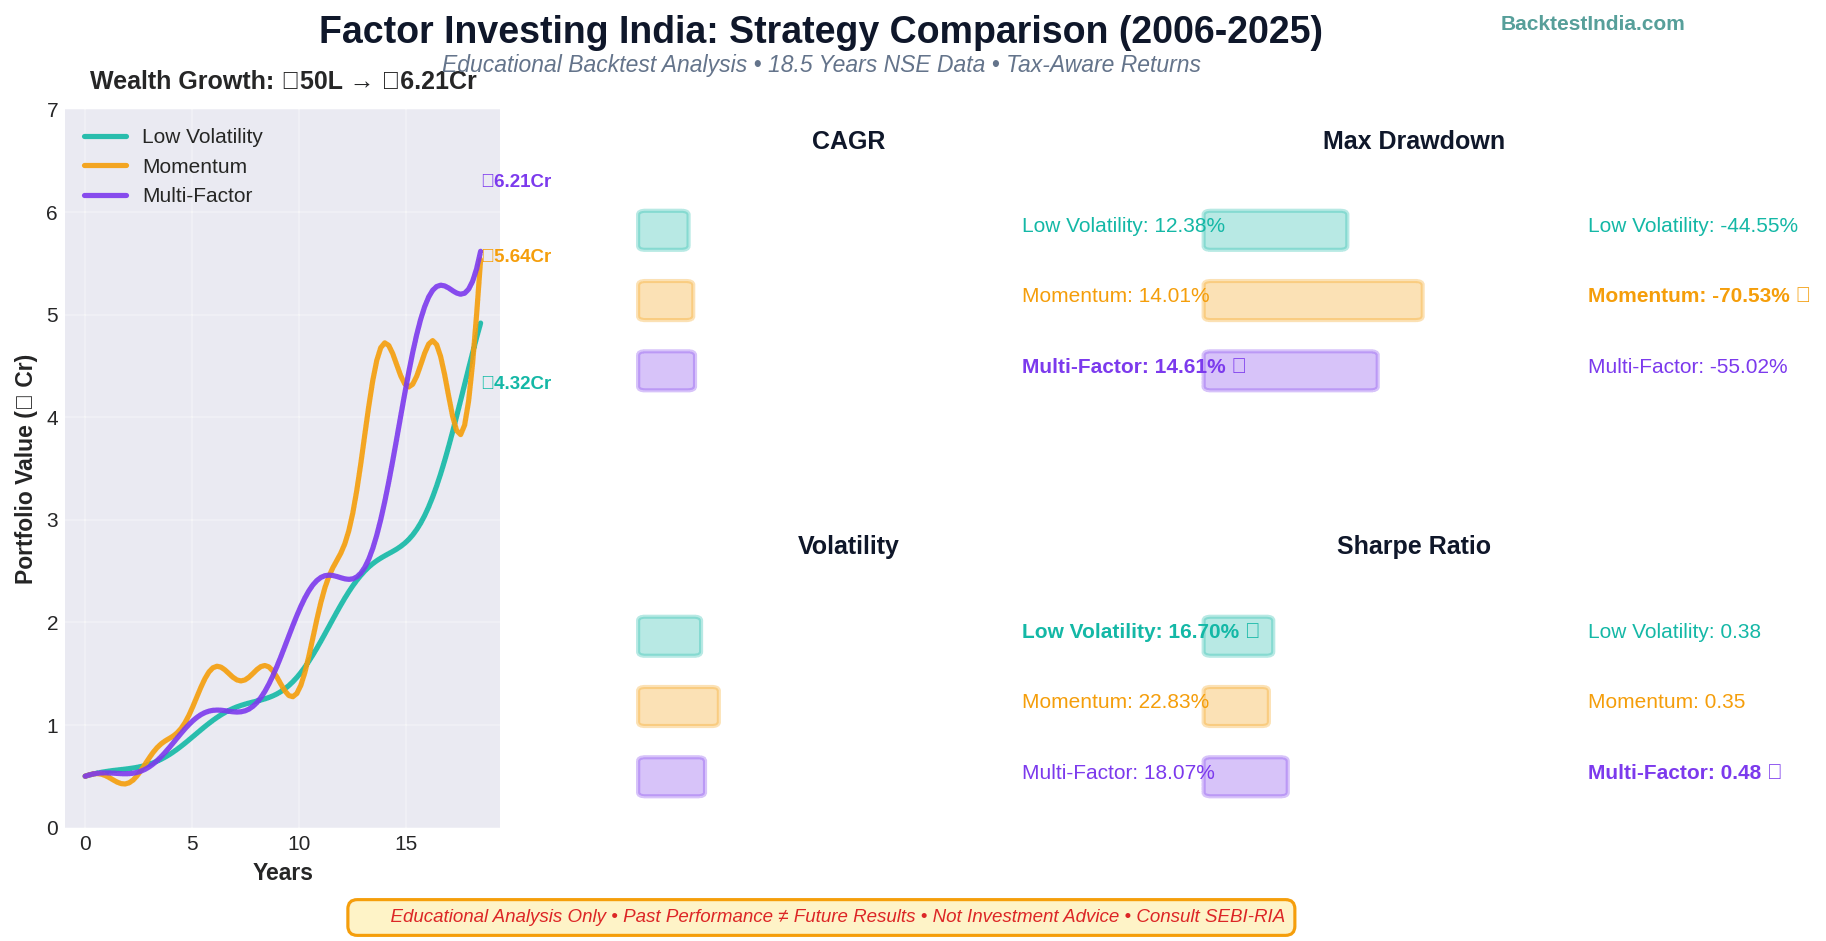
Multi-Factor Investing India: Historical Risk-Adjusted NSE Backtest (18-Year)
Sequential factor filtering combines defensive and growth for superior risk-adjusted returns. Complete 18-year NSE backtest with tax analysis.
See also: Low Volatility Foundation · Drawdown Analysis
Quality Momentum India: 18% Returns with Anti-Speculation Filter (18-Year Backtest)
Sequential filtering with scaled turnover — historical 18-year backtest with case studies showing how the filter identified high-risk speculative stocks 12-24 months before collapse. Educational data only.
See also: Pure Momentum Baseline · Tax Impact
Value-Quality Investing India: Tax-Aware Backtest (18-Year NSE Simulation)
Low PE/PB + High ROE growth delivered 11.38% net CAGR—but 4.02% consumed by taxes and costs. Sequential Z-score filtering with 7-month recovery vs Nifty's 60 months. Complete friction analysis.
See also: Quality-Momentum Alternative · Tax Drag Analysis
🔬 Research
8 articlesOriginal findings: liquidity premium decomposition, rolling returns across 102 periods, 2008 GFC crash analysis, and index comparisons on Indian equity markets.
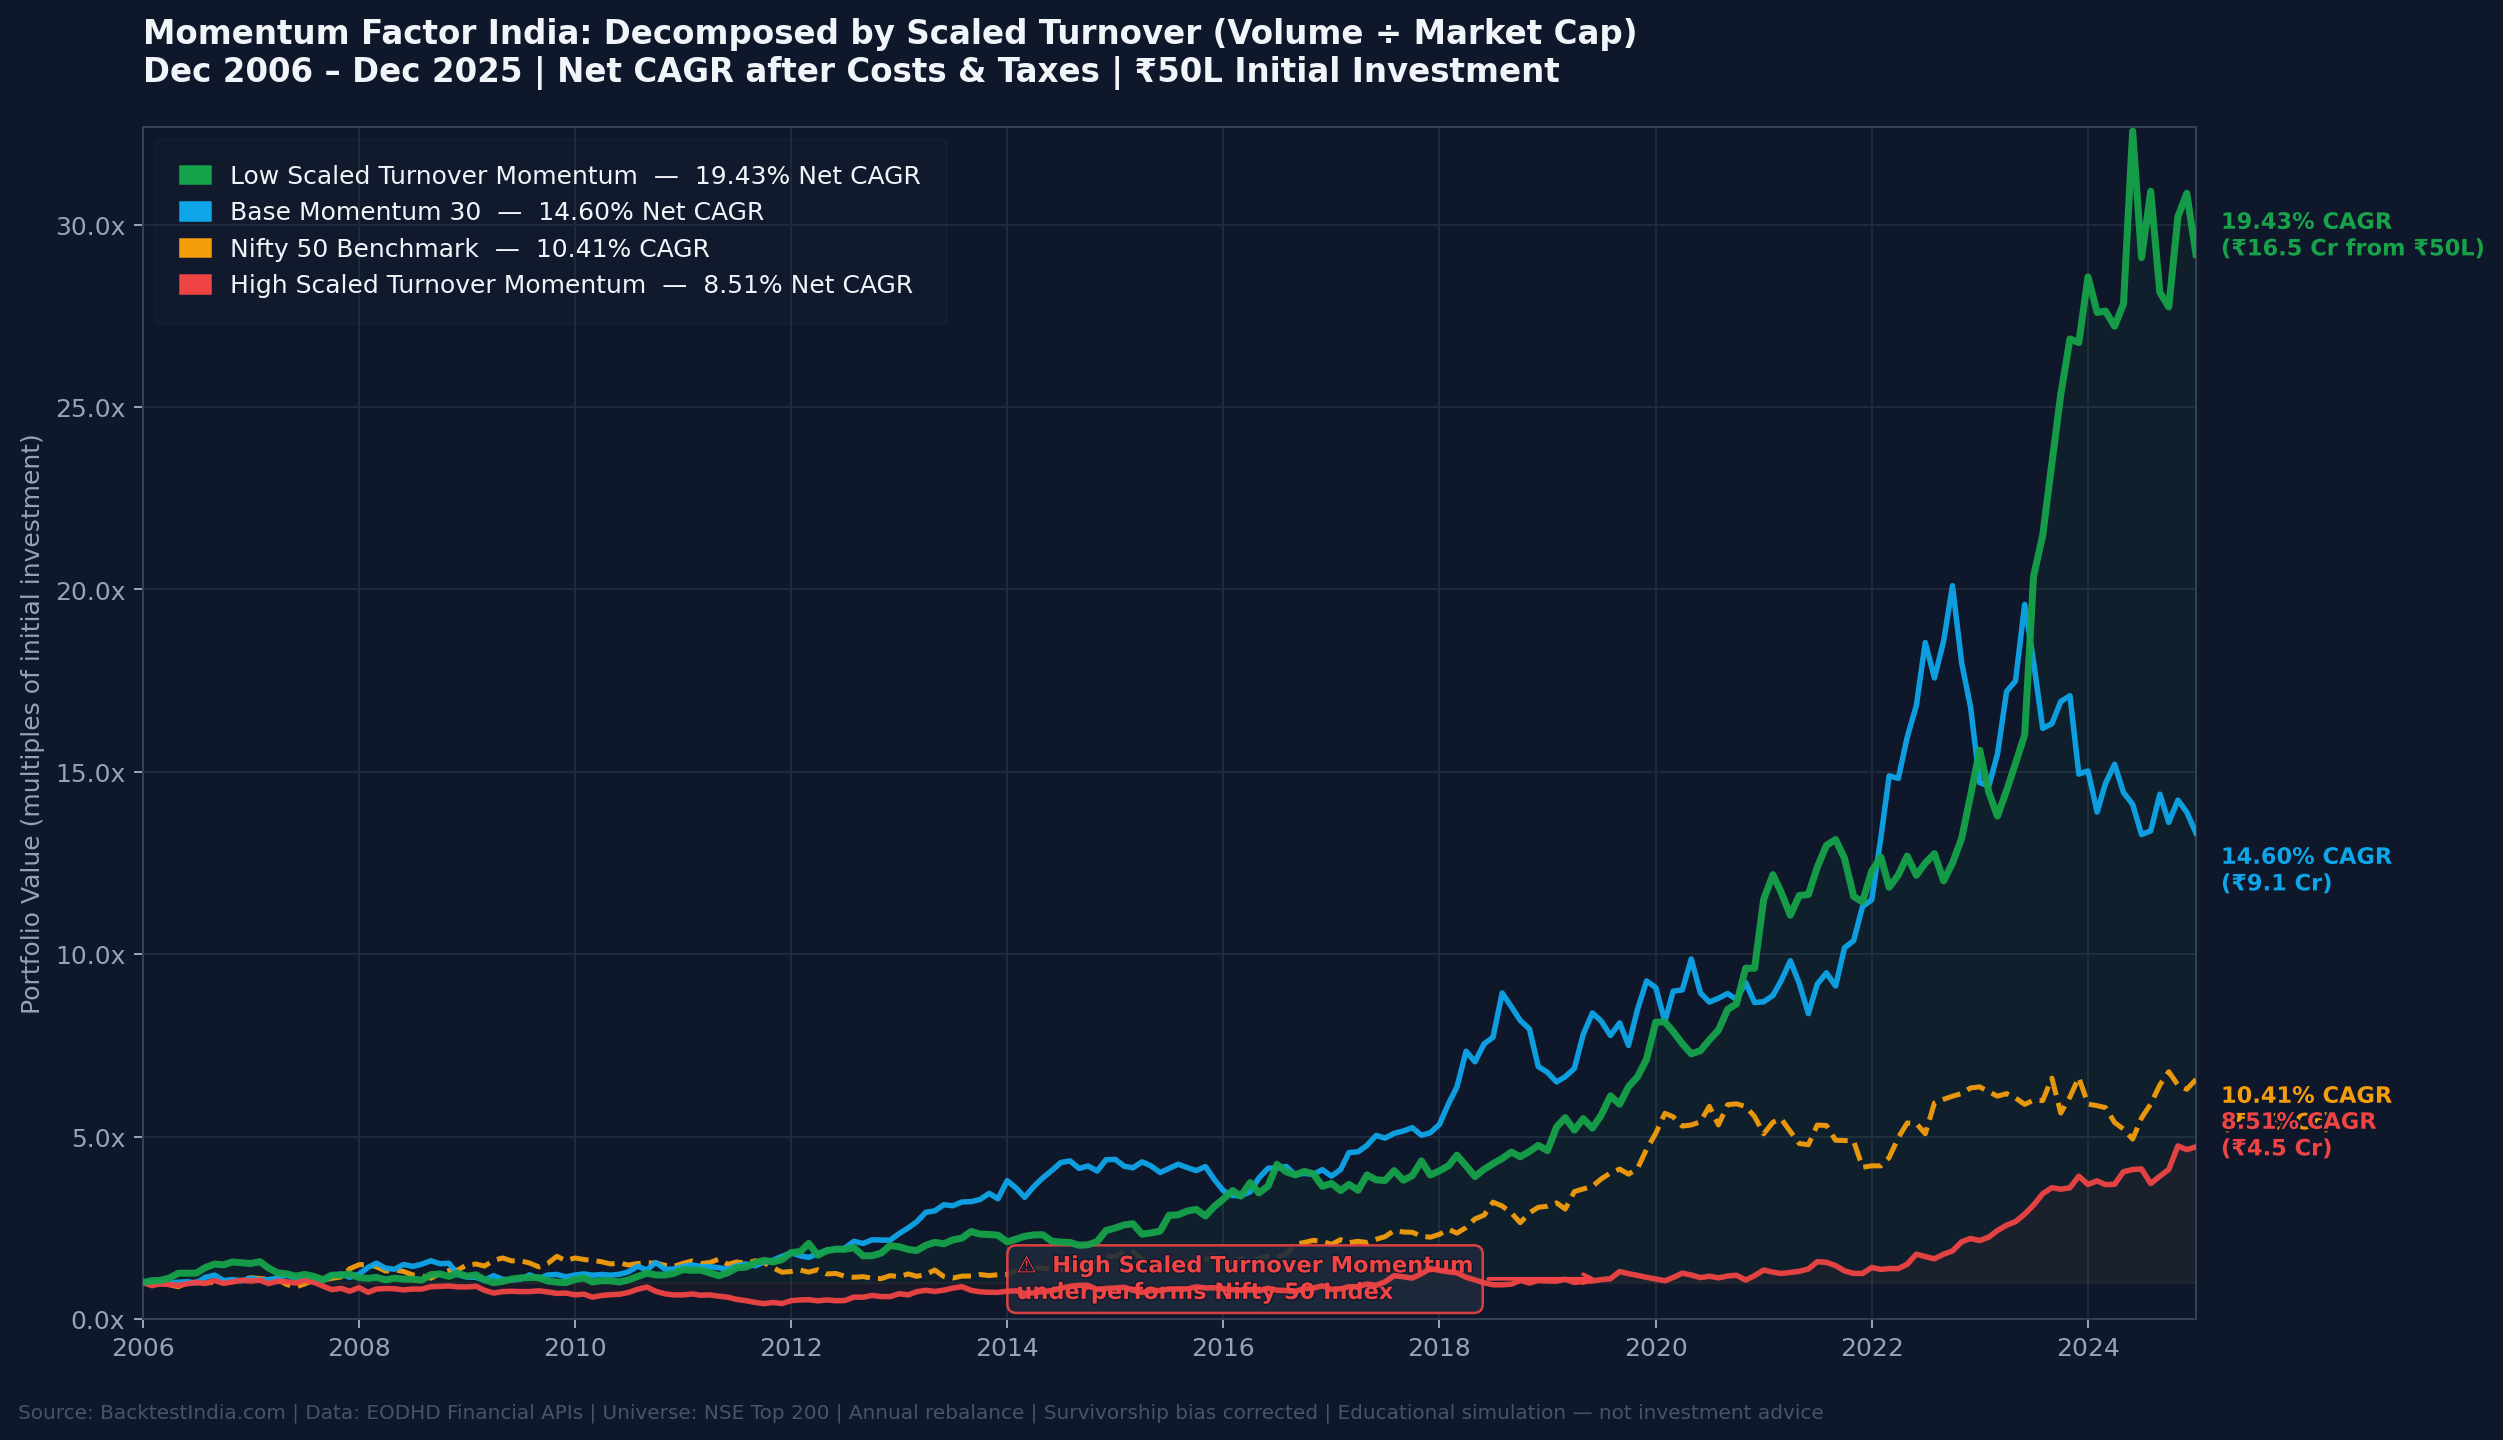
Indian Momentum Factor Is a Liquidity Premium in Disguise: 19-Year NSE Backtest
We split Nifty 200 Momentum 30 by Scaled Turnover (volume ÷ market cap). In this 19-year dataset, high-turnover momentum returned just 8.51% — below Nifty 50. Low-turnover momentum returned 19.43%. All historical return premium concentrated in illiquid stocks.
See also: Pure Momentum · Quality-Momentum
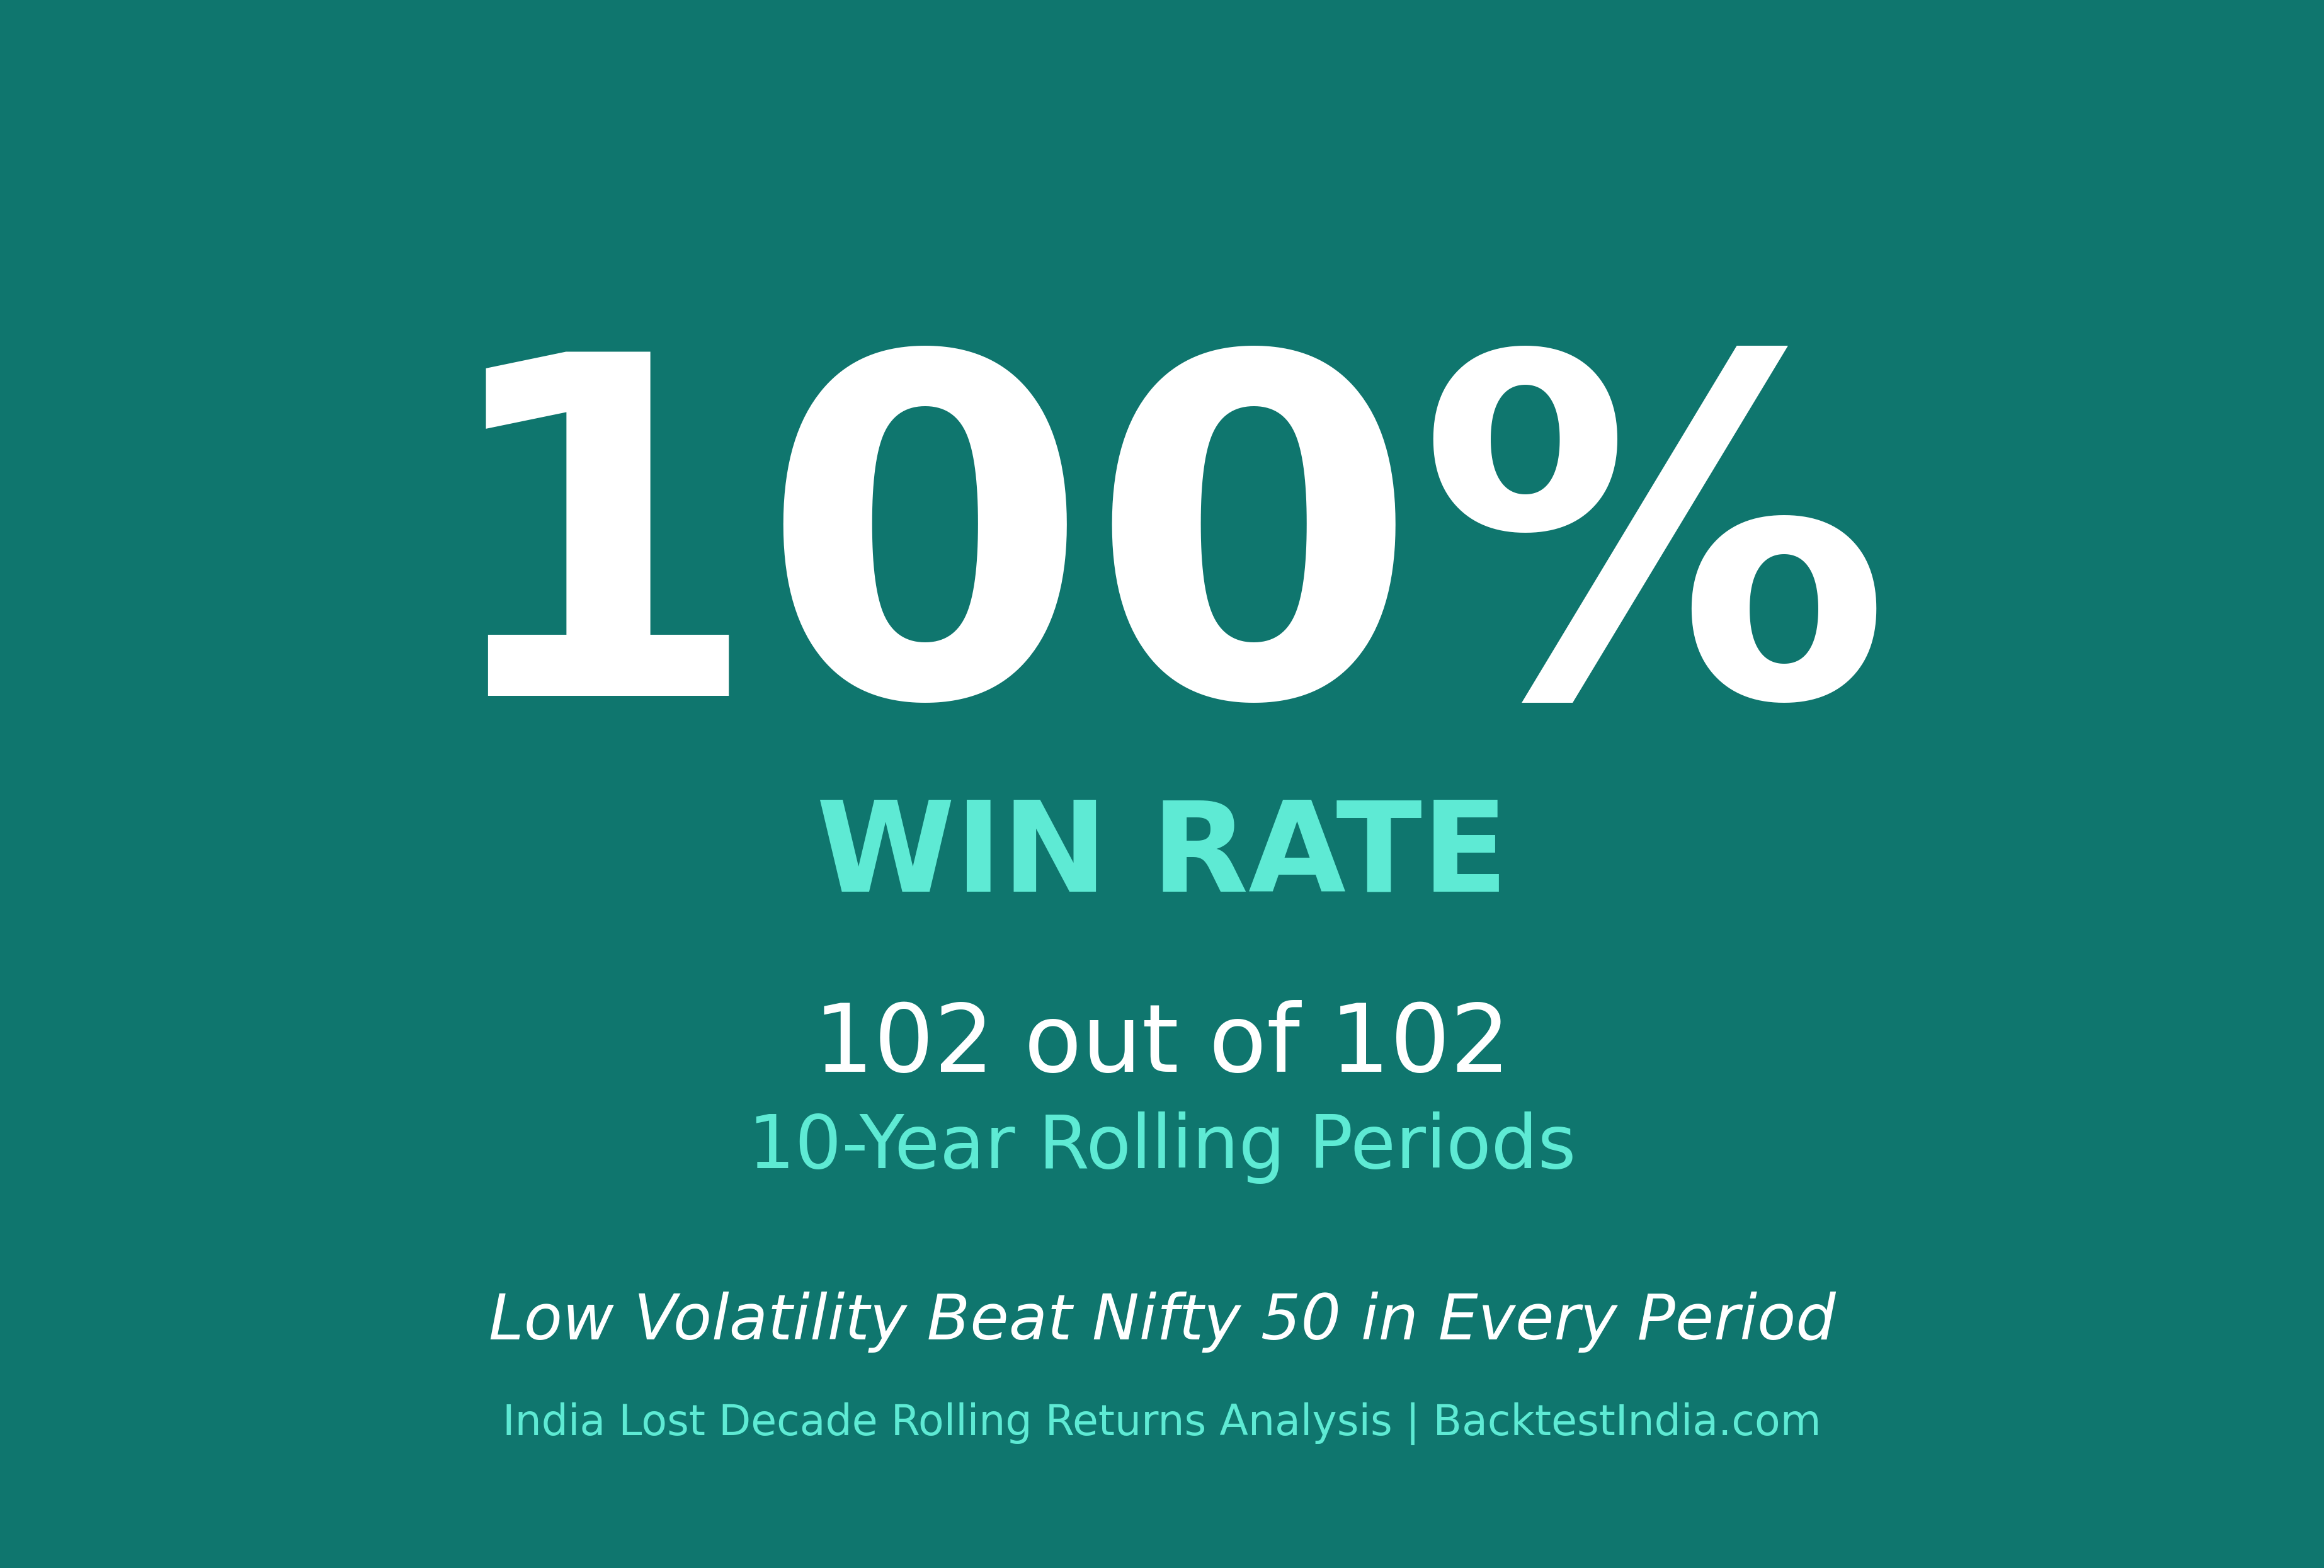
India's Lost Decade: Rolling Returns Analysis Across 102 Entry Points
Reddit users said we cherry-picked 2007-2017. We tested 102 different 10-year entry points. Low Volatility produced higher returns than Nifty in all tested periods in this dataset. Complete rolling returns analysis with SIP comparison. Historical data only.
See also: Low Volatility Backtest · Nifty 50 vs Next 50
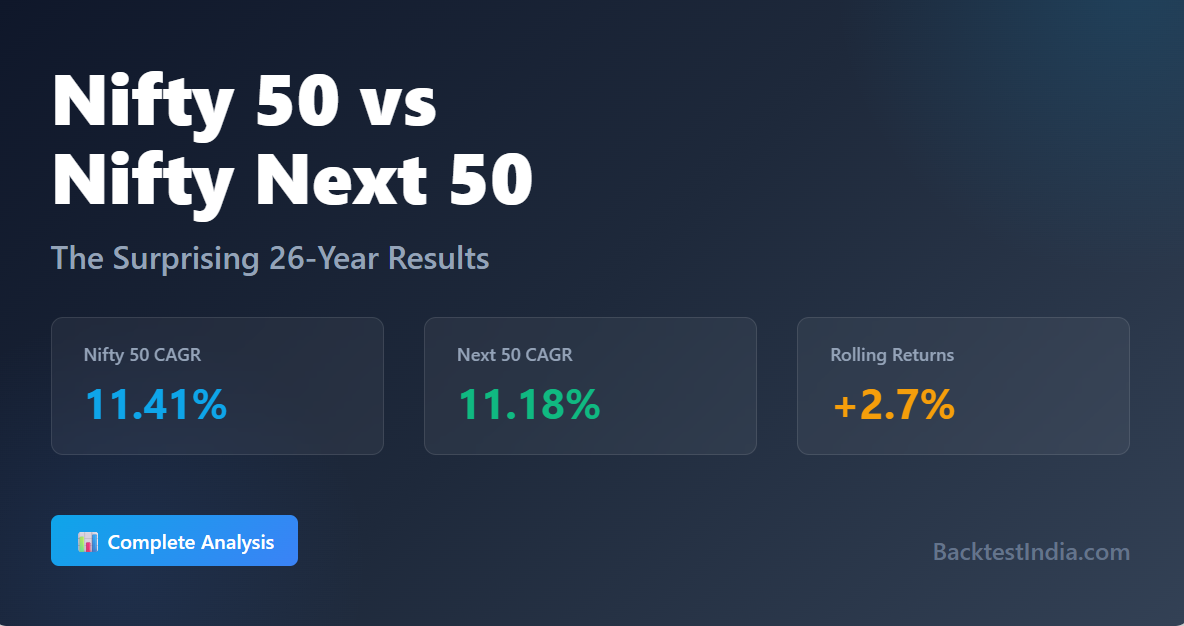
Nifty 50 vs Nifty Next 50: The Surprising 26-Year Results
Counterintuitive findings: Nifty 50 delivered 11.41% CAGR vs Next 50's 11.18% over 26 years—but rolling returns reveal Next 50 averaged 16.49% on 5-year basis. Complete drawdown analysis (-55% vs -76%) showing when each index wins.
See also: Drawdown Strategies · Factor Investing Guide
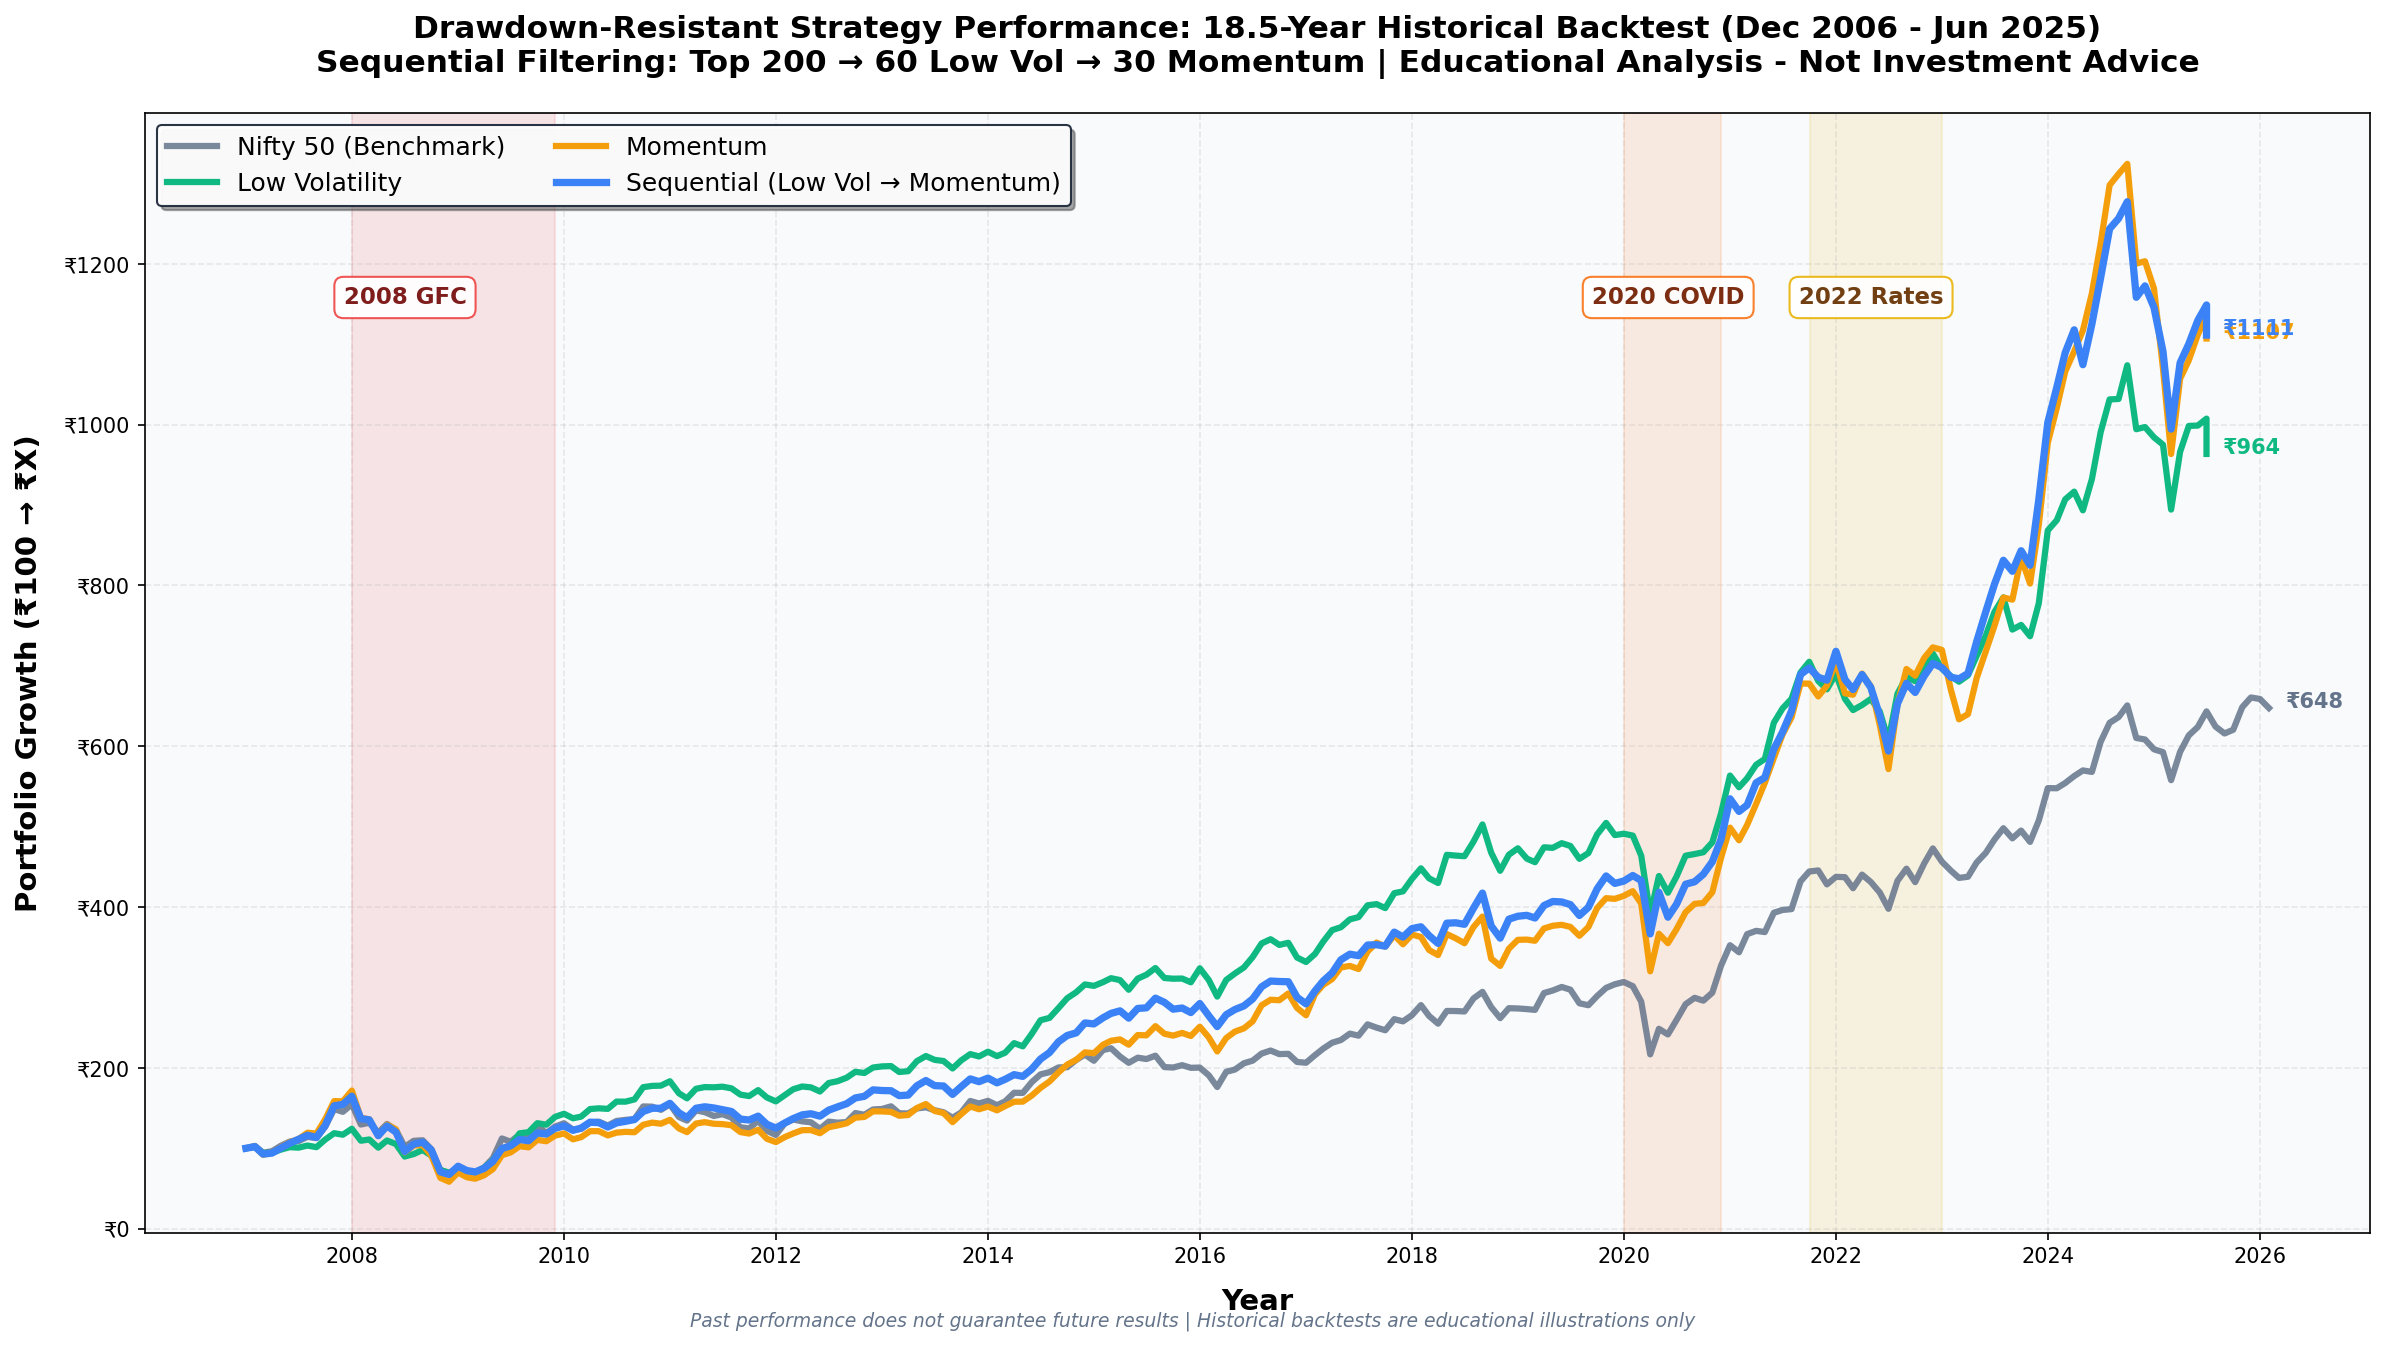
Backtesting Drawdown-Resistant Factor Strategies in India: Complete Guide (2006-2025)
Sequential filtering (Top 200→60 Low Vol→30 Momentum) showed -16.5% drawdown in 2020 vs Nifty's -29%. Complete 18-year crisis analysis across 2008 GFC, 2020 COVID, 2022 rate hikes with tax-aware calculations.
See also: Low Volatility · Multi-Factor

The 2008 Crash, Month by Month: ₹1 Crore in Low Volatility vs Nifty 50
Month-by-month rupee values through India's worst modern crash. Low Volatility fell −44.6% (trough: Feb 2009, ₹55.4L) vs Nifty's −55.1% (trough: Nov 2008, ₹44.9L). LV recovered fully in 7 months. Nifty took 59 months. Phase-by-phase crash and recovery analysis.
See also: Full Low Volatility Backtest · Drawdown-Resistant Strategies
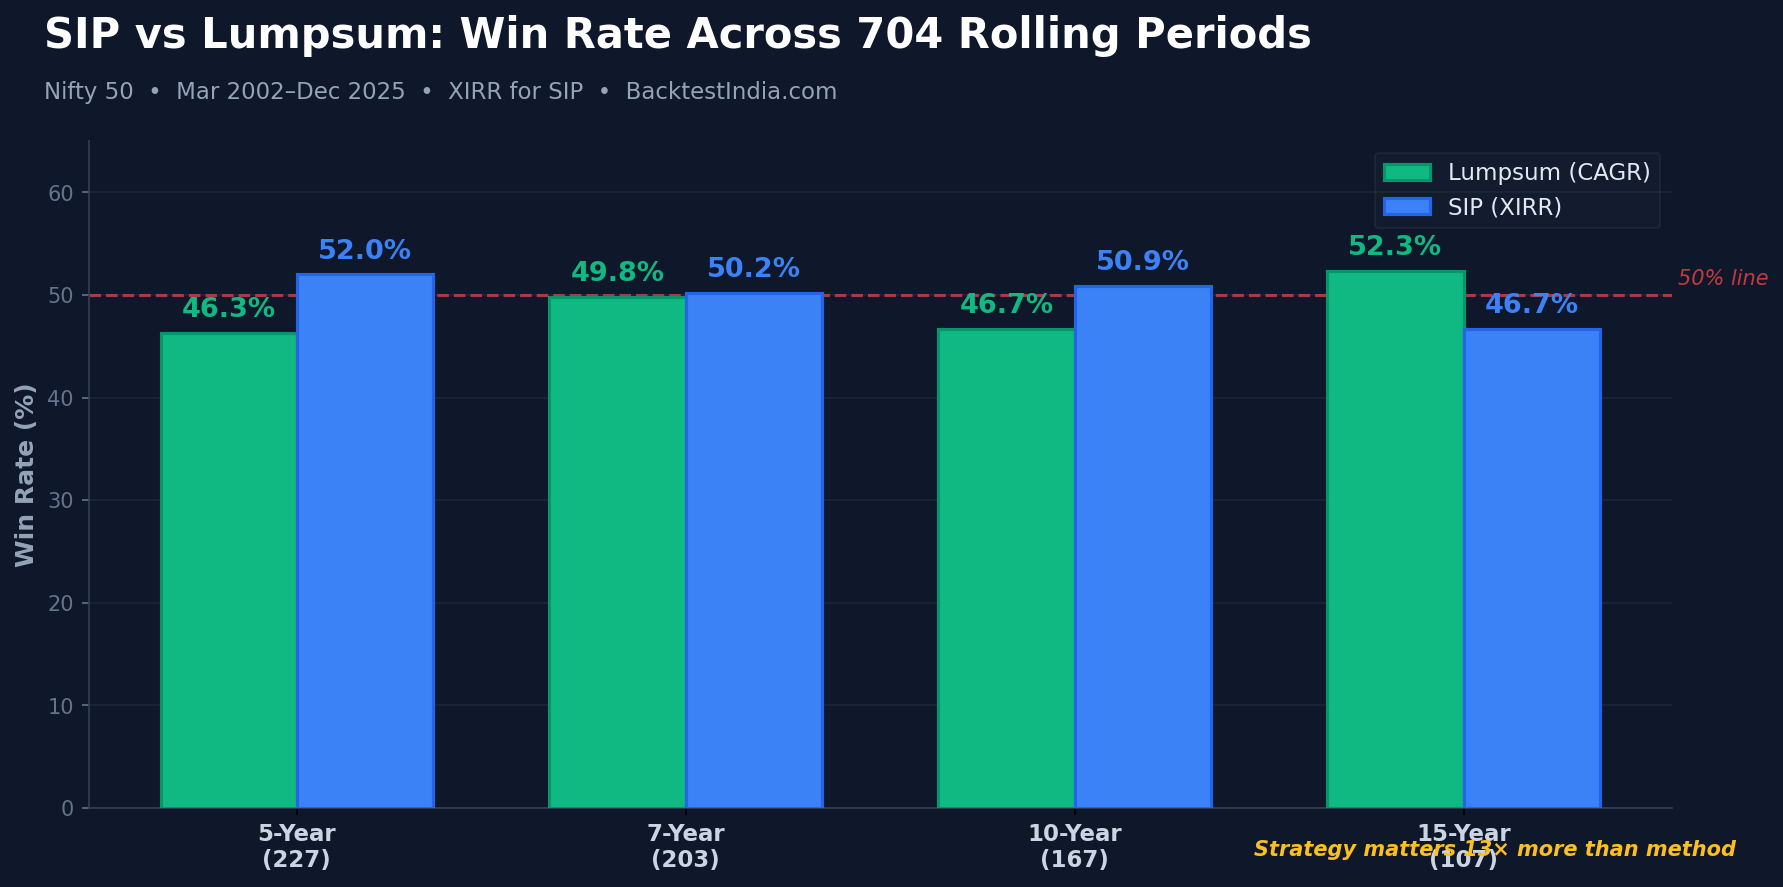
SIP vs Lumpsum India: 23-Year XIRR Rolling Returns on Nifty 50—Neither Is Foolproof
704 rolling periods tested using proper XIRR methodology. SIP won 52% of 5-year windows. Lumpsum won 52% of 15-year windows. Worst SIP XIRR: -4.17%. Strategy matters 13× more than deployment method. Complete analysis with staggered lumpsum comparison.
See also: Low Vol Rolling Returns · Factor Investing Guide
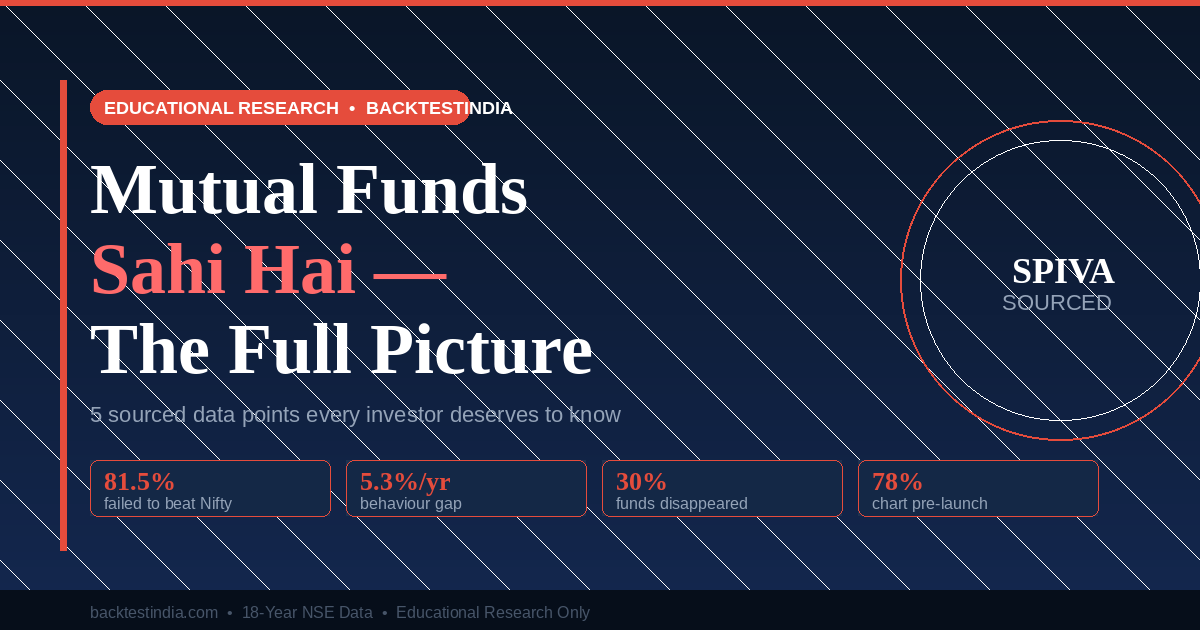
Mutual Funds Sahi Hai — But Is the Whole Truth Sahi Hai?
81.5% of large-cap funds failed to beat Nifty (SPIVA 2024). Investors earned 5.3% less than their own funds. 30% of funds quietly disappeared. 78% of smart beta charts pre-date live trading. The 5 data points every Indian investor deserves to know. Every claim sourced.
See also: Rolling Returns: Historical Consistency Study · Low Volatility Backtest

Scaled Turnover Factor: Nifty 500 Universal Liquidity Premium (18-Year NSE Backtest)
Extending the scaled turnover liquidity premium research from Nifty 200 to the broader Nifty 500 universe. How does the liquidity-adjusted factor perform across 500 stocks? Complete 18-year backtest comparing turnover-sorted deciles, sector biases, and implementation costs.
See also: Nifty 200 Liquidity Decomposition · Quality-Momentum with Scaled Turnover
🧾 Tax Analysis
1 articleHow LTCG vs STCG rebalancing frequency affects compounded returns — quantified across all 5 factor strategies.
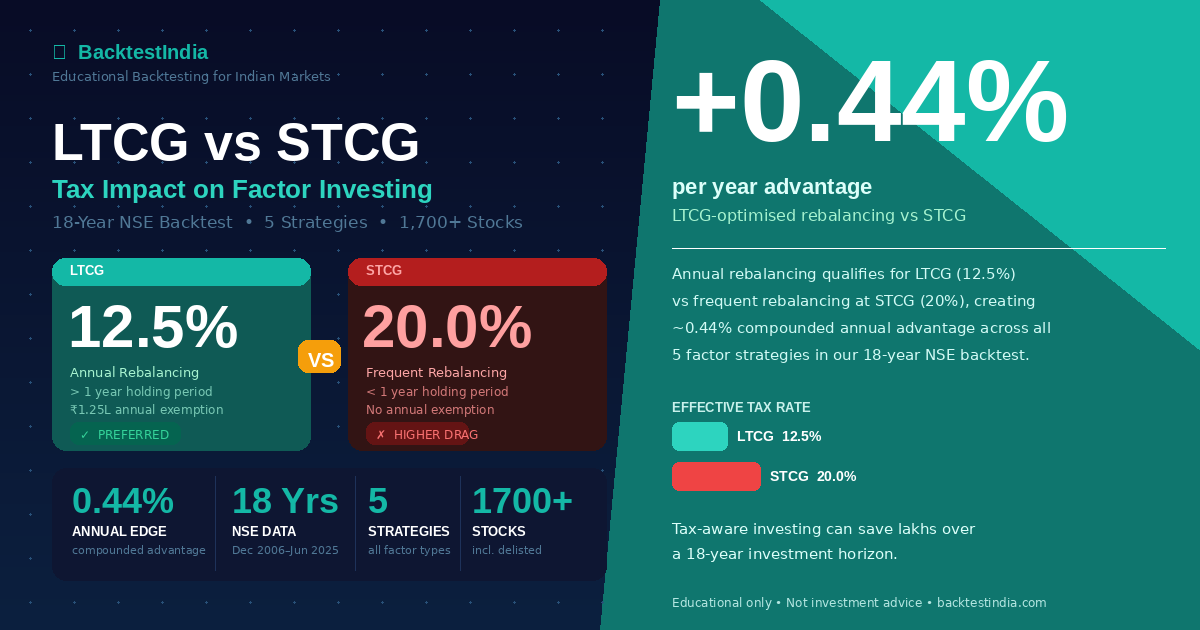
LTCG vs STCG Tax Impact on Factor Investing India: 0.44% Annual Advantage (18-Year Backtest)
Annual rebalancing (LTCG 12.5%) vs frequent rebalancing (STCG 20%) shows ~0.44%/year compounded advantage. 18-year NSE study across 5 factor strategies, 1,700+ stocks (Dec 2006–Jun 2025). Tax-aware systematic investing analysis.
See also: Quality-Momentum (Highest Net Return) · All 5 Strategies
Get New Articles in Your Inbox
Join readers getting updates on new backtests, strategy analysis,
and factor investing research for Indian markets.
✅ No spam ever • ✅ Unsubscribe anytime • ✅ 100% free
Not ready to subscribe? Start with our most popular article: India's Lost Decade: 102 Entry Points Tested →