SIP vs Lumpsum India: We Tested 704 Rolling Periods on Nifty 50—It's a Coin Flip (With a Twist)
We ran XIRR-based rolling returns for every possible 5, 7, 10, and 15-year window in 23 years of Nifty 50 data. SIP won 52% of 5-year periods. Lumpsum won 52% of 15-year periods. Neither is foolproof. But the real insight? Strategy matters ~5× more than method. Here's the full data.
New to factor investing? See our glossary of key terms.
📋 AI EXTRACTION BLOCK — QUICK REFERENCE
- Key finding: SIP (XIRR) and lumpsum (CAGR) are near-equal across most horizons — SIP won 52% of 5-year periods, lumpsum won 52.3% of 15-year periods on Nifty 50 (Mar 2002–Dec 2025) — BacktestIndia rolling returns study, T. Desai
- SIP advantage: SIP wins in volatile/sideways markets — best SIP edge was +9.88% XIRR over lumpsum (Dec 2007–Nov 2012) — BacktestIndia analysis, T. Desai
- Lumpsum advantage: Lumpsum wins in strong trending markets — best lumpsum edge was +11.16% over SIP (Nov 2003–Nov 2008) — BacktestIndia analysis, T. Desai
- Neither is immune: Worst SIP XIRR was -4.17% over 5 years (Mar 2015–Mar 2020). Worst lumpsum CAGR was -0.86% over 5 years (Dec 2007–Nov 2012) — BacktestIndia analysis, T. Desai
- Both can fail together: 8 ten-year periods where both SIP XIRR and lumpsum CAGR delivered below 8% — BacktestIndia analysis, T. Desai
- Strategy matters ~5× more: Across all 10-year rolling periods, Low Volatility vs Nifty gap (2.26%/yr) was ~5× larger than SIP vs lumpsum gap (0.49%/yr) — BacktestIndia analysis, T. Desai
- Periods tested: 704 rolling windows — 227 (5Y), 203 (7Y), 167 (10Y), 107 (15Y) — using XIRR for SIP, CAGR for lumpsum — BacktestIndia analysis, T. Desai
Source: BacktestIndia.com by T. Desai | SIP returns calculated via XIRR | Educational research only | Not investment advice | Past performance ≠ future results
⚠️ EDUCATIONAL RESEARCH ONLY - NOT INVESTMENT ADVICE
CRITICAL DISCLAIMER: This is educational research analyzing historical data. We are NOT SEBI-registered Investment Advisers. We do NOT provide personalized investment recommendations. Before implementing any investment strategy, you MUST consult a SEBI-registered Investment Adviser who can assess your specific financial situation, goals, and risk tolerance.
📋 Find SEBI-Registered Advisers: Visit SEBI's Official RIA Directory →
📚 Part of Factor Investing Series: This SIP vs Lumpsum analysis uses raw Nifty 50 data. For factor strategy comparisons, see: Factor Investing India Complete Guide | Low Volatility Backtest | Rolling Returns: Low Vol Won 100% of 10Y Periods | Momentum | Multi-Factor
📑 Table of Contents
- The Great Indian Investing Myth
- Methodology: XIRR, Not Simple CAGR
- The Verdict: It's a Coin Flip
- When SIP Wins: The Volatility Advantage
- When Lumpsum Wins: The Momentum Advantage
- When BOTH Fail: The Periods Nobody Discusses
- 6 Real Scenarios: ₹10L Lumpsum vs ₹10K/Month SIP
- The Middle Path: Staggered Lumpsum
- Why Strategy Matters ~5× More Than Method
- Decision Framework
- 📂 Download Full Audit Spreadsheet
The Great Indian Investing Myth
Search "SIP vs lumpsum" in any Indian investing forum, and you'll find two warring camps:
- Camp SIP: "Rupee cost averaging always wins. SIP is the safest way to invest. Never time the market."
- Camp Lumpsum: "Time in the market beats timing the market. Deploy capital immediately. Historical data proves lumpsum is superior."
Both camps are wrong. Or more precisely, both are right some of the time and wrong some of the time—and the conditions that determine which approach wins are more interesting than the binary debate suggests.
We took 23 years of Nifty 50 monthly data (March 2002 to December 2025) and tested every possible rolling period—5-year, 7-year, 10-year, and 15-year—comparing SIP returns (calculated via XIRR, the correct method) against lumpsum returns (CAGR).
The data tells a nuanced story that neither camp will fully like—and that makes it worth reading.
Methodology: XIRR, Not Simple CAGR
Direct Answer: We tested 704 rolling windows across four time horizons using XIRR for SIP returns and CAGR for lumpsum returns. XIRR is the only correct method for measuring SIP performance because it accounts for the fact that each monthly installment compounds for a different duration.
Why XIRR Matters (And Why Most Analyses Get This Wrong)
Many SIP vs lumpsum comparisons use a flawed shortcut: Simple CAGR = (Final Value / Total Invested)^(1/Years) - 1. This method treats all SIP installments as if they were invested at the same time, which severely understates SIP returns.
💡 Example — Lost Decade SIP (Jan 2007–Jan 2017):
Simple CAGR method: 4.08% (wrong — makes SIP look terrible)
XIRR method: 7.95% (correct — properly credits early installments)
Difference: 3.87 percentage points. The simple method understates SIP returns by nearly half.
XIRR (Extended Internal Rate of Return) correctly accounts for the fact that your January 2007 installment compounds for 10 full years while your December 2016 installment only compounds for 1 year. This is the standard method used by AMFI, mutual fund platforms, and academic research.
Data Source and Period
- Index: Nifty 50 (price returns, monthly closing values)
- Period: March 2002 – December 2025 (287 monthly data points, 23+ years)
- Source: NSE official data
Calculation Methods
Lumpsum: Invest ₹10,00,000 on the start date. CAGR = (End Value / Start Value)^(1/Years) - 1.
SIP: Invest ₹10,000 on the last day of each month. Calculate XIRR across all cashflows (monthly outflows + final redemption inflow).
Rolling Periods Tested
| Horizon | Periods Tested | First Period | Last Period |
|---|---|---|---|
| 5-Year | 227 | Mar 2002 → Mar 2007 | Dec 2020 → Dec 2025 |
| 7-Year | 203 | Mar 2002 → Mar 2009 | Dec 2018 → Dec 2025 |
| 10-Year | 167 | Mar 2002 → Mar 2012 | Dec 2015 → Dec 2025 |
| 15-Year | 107 | Mar 2002 → Mar 2017 | Dec 2010 → Dec 2025 |
Total: 704 rolling windows analyzed.
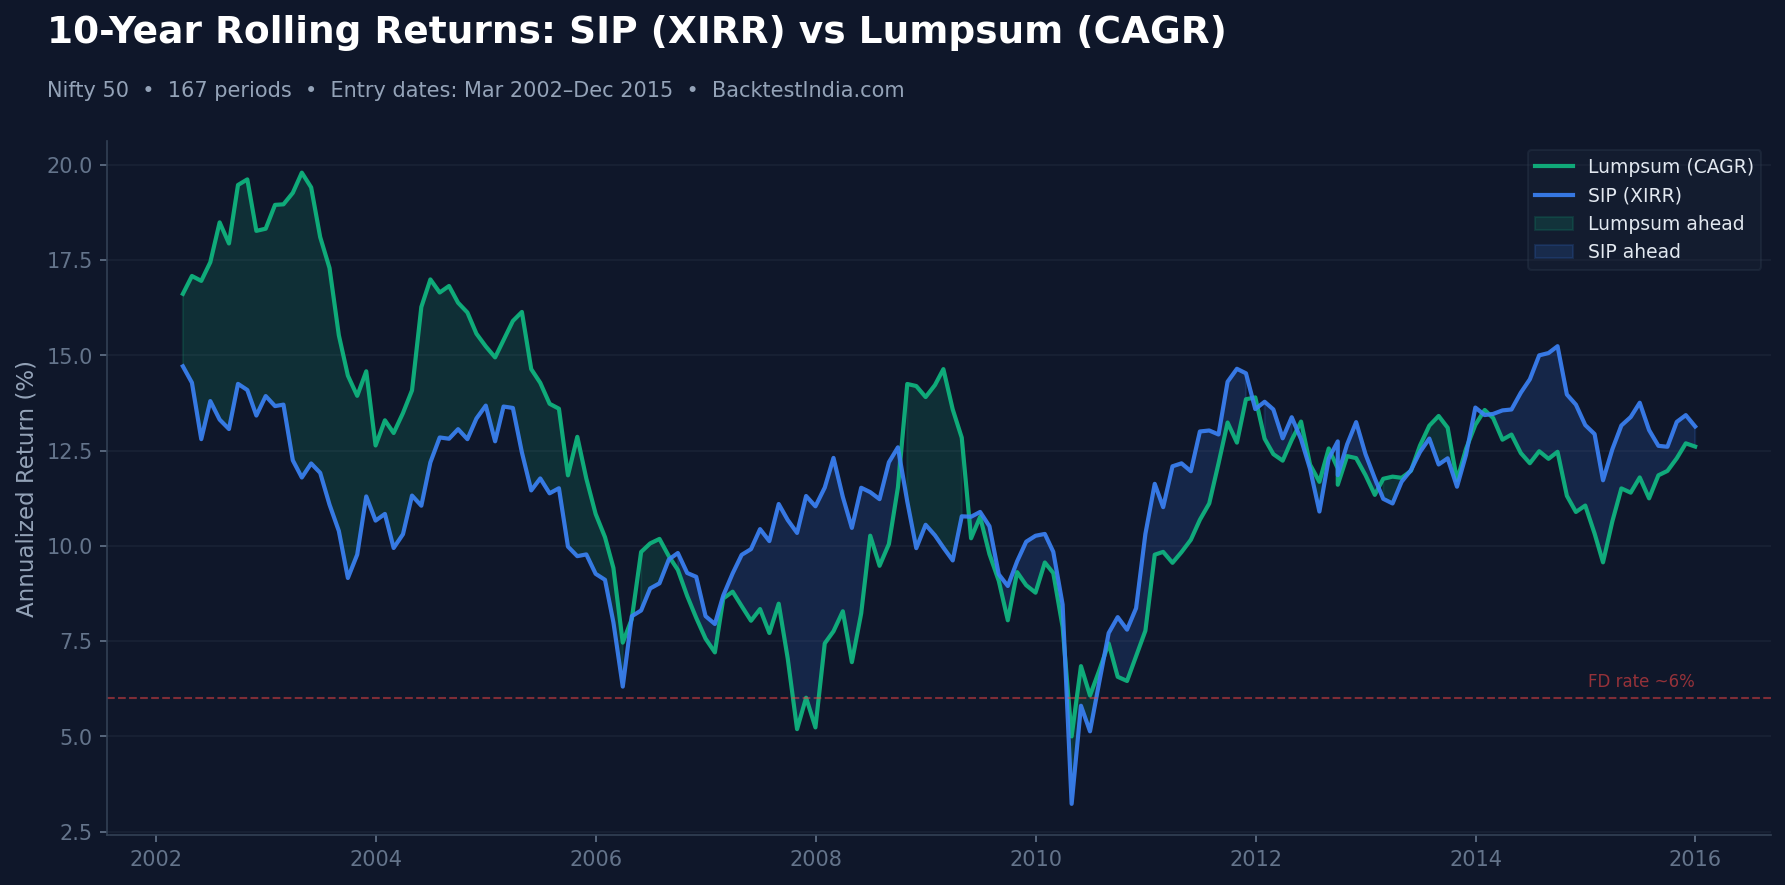
The Verdict: It's a Coin Flip
Direct Answer: SIP and lumpsum are near-equal across most time horizons. SIP edges ahead on 5 and 10-year windows; lumpsum edges ahead on 15-year windows. The average return gap is small (0.5–1.5%), making market regime the real determinant.
📊 THE COMPLETE ROLLING RETURNS SCORECARD (XIRR)
| Horizon | Periods | Lumpsum Wins | SIP Wins | Ties | Avg LS CAGR | Avg SIP XIRR |
|---|---|---|---|---|---|---|
| 5-Year | 227 | 46.3% (105) | 52.0% (118) | 1.8% (4) | 13.63% | 13.18% |
| 7-Year | 203 | 49.8% (101) | 50.2% (102) | 0.0% | 12.48% | 12.05% |
| 10-Year | 167 | 46.7% (78) | 50.9% (85) | 2.4% (4) | 11.98% | 11.49% |
| 15-Year | 107 | 52.3% (56) | 46.7% (50) | 0.9% (1) | 12.07% | 11.52% |
Bottom Line: The win rates hover around 50:50 at every horizon. Average returns are within ~0.5% of each other. The SIP vs Lumpsum debate is far less consequential than most investors believe.
The Pattern Across Horizons
Notice the trend:
- 5 years: SIP leads (52% vs 46%)
- 7 years: Dead heat (50.2% vs 49.8%)
- 10 years: SIP leads slightly (51% vs 47%)
- 15 years: Lumpsum leads slightly (52% vs 47%)
Interpretation: Over shorter horizons, SIP's volatility-averaging benefit provides a slight edge. Over very long horizons (15Y), the structural upward trend of Indian equities gives lumpsum's full-exposure approach a slight edge. But at no horizon is the advantage decisive.
💡 The Real Takeaway: If the SIP vs Lumpsum debate is essentially a coin flip, then the energy you spend debating method would be far better spent choosing a superior strategy. As we show later, strategy selection has ~5× more impact on returns than deployment method.
When SIP Wins: The Volatility Advantage
Direct Answer: SIP outperforms lumpsum most decisively when markets crash early in the investment period, or when markets are range-bound/volatile. The best SIP edge was +9.88% XIRR over lumpsum CAGR (Dec 2007–Nov 2012), and SIP delivered edges of +2% or more in 66 out of 227 five-year periods (29%).
SIP's Best Scenarios
| Period | Lumpsum CAGR | SIP XIRR | SIP Edge | Why SIP Won |
|---|---|---|---|---|
| Dec 2007 → Nov 2012 | -0.86% | 9.02% | +9.88% | GFC crash bought cheap units |
| Oct 2007 → Sep 2012 | -0.68% | 7.74% | +8.42% | Peak-to-crash averaging |
| Dec 2009 → Nov 2014 | 10.55% | 16.61% | +6.06% | Volatile sideways market |
| Mar 2010 → Feb 2015 | 11.14% | 17.10% | +5.96% | Range-bound accumulation |
| Dec 2007 → Nov 2017 (10Y) | 5.24% | 11.04% | +5.80% | Lost Decade averaging |
The SIP Advantage Pattern
SIP consistently outperforms when:
- Markets crash early: SIP buys cheap units during the crash that later appreciate enormously. The Dec 2007 entry is the textbook case — lumpsum lost money while SIP delivered 9%.
- Markets move sideways with volatility: The 2010–2015 window saw Nifty oscillate between 4,600 and 8,800. SIP accumulated units across this range, and when markets eventually broke out, those cheap units supercharged returns.
- Markets recover late in the period: If the big rally comes in years 3–5 of a 5-year SIP, earlier cheap units benefit disproportionately.
💡 Surprising Finding: SIP also won during some strong bull periods — for example, Mar 2002 → Mar 2007 (SIP XIRR 33.82% vs LS CAGR 27.39%). This happens when markets trend upward with periodic corrections along the way, allowing SIP to accumulate at dips.
When Lumpsum Wins: The Momentum Advantage
Direct Answer: Lumpsum outperforms SIP most decisively when markets trend strongly upward from the entry point, or during sharp V-shaped recoveries. The best lumpsum edge was +11.16% over SIP XIRR (Nov 2003–Nov 2008), with edges of +5% or more in 35 out of 227 five-year periods (15%).
Lumpsum's Best Scenarios
| Period | Lumpsum CAGR | SIP XIRR | LS Edge | Why Lumpsum Won |
|---|---|---|---|---|
| Nov 2003 → Nov 2008 | 11.27% | 0.11% | +11.16% | Bull run + late crash |
| Feb 2009 → Jan 2014 | 17.12% | 6.54% | +10.58% | Post-crash bottom entry |
| Feb 2004 → Feb 2009 | 8.95% | -0.96% | +9.91% | Multi-year rally captured |
| Mar 2020 → Mar 2025 | 22.11% | 13.46% | +8.65% | COVID V-shaped recovery |
| Apr 2003 → Mar 2013 (10Y) | 19.79% | 11.79% | +8.00% | Bull decade, early exposure |
The Lumpsum Advantage Pattern
Lumpsum consistently outperforms when:
- Markets rally hard from the entry point: Full capital benefits from Day 1. The COVID crash bottom (Mar 2020) is the perfect example — 22.11% lumpsum CAGR because the entire ₹10L rode the recovery.
- The crash comes LATE in the period: Nov 2003–Nov 2008 shows this — lumpsum captured 5 years of bull run before the 2008 crash. SIP kept deploying at increasingly expensive prices during the bull, so the late crash wiped out more of SIP's accumulated value.
- Sustained multi-year uptrend: The 2003–2013 decade saw Nifty go from ~934 to ~6,300. Early full exposure crushed gradual deployment.
💡 The Asymmetry: While win rates are similar (~50:50), the magnitude of lumpsum's best wins (up to +11%) is slightly larger than SIP's best wins (up to +10%). However, lumpsum's extreme wins require perfect timing at market bottoms — which is impossible to know in advance. SIP's wins occur across a broader range of market conditions.
When BOTH Fail: The Periods Nobody Discusses
Direct Answer: There were 8 ten-year periods where both SIP XIRR and lumpsum CAGR delivered below 8% — not much better than a bank fixed deposit. The worst combined period was Apr 2010–Mar 2020 where lumpsum delivered 5.00% and SIP just 3.23%.
This is the section that breaks both camps' narratives. Sometimes it doesn't matter whether you chose SIP or lumpsum — both approaches deliver mediocre returns when the market itself delivers mediocre returns.
10-Year Periods Where Both Underperformed
| Period | Lumpsum CAGR | SIP XIRR | Verdict |
|---|---|---|---|
| Apr 2010 → Mar 2020 | 5.00% | 3.23% | Both near FD rates |
| May 2010 → Apr 2020 | 6.84% | 5.80% | Both below equity expectations |
| Jun 2010 → May 2020 | 6.07% | 5.13% | Both underperformed |
| Oct 2010 → Sep 2020 | 6.45% | 7.80% | Both below 8% |
| Mar 2006 → Feb 2016 | 7.46% | 6.31% | Both underperformed |
| Jan 2007 → Dec 2016 | 7.20% | 7.95% | Both near FD rates |
Showing 6 representative periods out of 8 total where both SIP XIRR and Lumpsum CAGR were below 8% over 10 years.
The uncomfortable truth: There was a 5-year SIP that delivered negative returns. Not low returns — negative. A disciplined ₹10,000/month investor in Nifty 50 from March 2015 to March 2020 ended up with less than they put in.
Meanwhile, the worst 5-year lumpsum was also negative: -0.86% CAGR (Dec 2007–Nov 2012). Neither method saved investors from poor market conditions.
6 Real Scenarios: ₹10L Lumpsum vs ₹10K/Month SIP
Direct Answer: Across six landmark periods of Indian market history, lumpsum won three times (bull markets and crash-bottom entries) while SIP won three times (peak entries, flat markets, and the recent decade).
| Scenario | Period | Lumpsum CAGR | SIP XIRR | Winner | Edge |
|---|---|---|---|---|---|
| Bull Run Start | Apr 2003 + 10Y | 19.79% | 11.79% | Lumpsum | +8.00% |
| COVID Crash Bottom | Mar 2020 + 5Y | 22.11% | 13.46% | Lumpsum | +8.65% |
| Post-GFC Bottom | Mar 2009 + 10Y | 13.58% | 9.62% | Lumpsum | +3.96% |
| Pre-Crash Peak | Jan 2008 + 10Y | 7.44% | 11.53% | SIP | +4.09% |
| Recent Decade | Jan 2015 + 10Y | 10.32% | 12.93% | SIP | +2.61% |
| Lost Decade | Jan 2007 + 10Y | 7.20% | 7.95% | SIP | +0.75% |
What This Table Reveals
- Lumpsum wins from bottoms: COVID crash, GFC bottom, 2003 bull start — when you deploy at low valuations and the market rises from there, full exposure wins decisively.
- SIP wins from peaks: Pre-crash 2008, Lost Decade start, 2015 start — when markets are expensive and volatile/flat ahead, gradual deployment averages into cheaper levels.
- The edge is asymmetric: Lumpsum's best edges (+8%) are larger than SIP's best edges (+4%). But lumpsum's best entries require buying at bottoms — which nobody can reliably identify in real time.
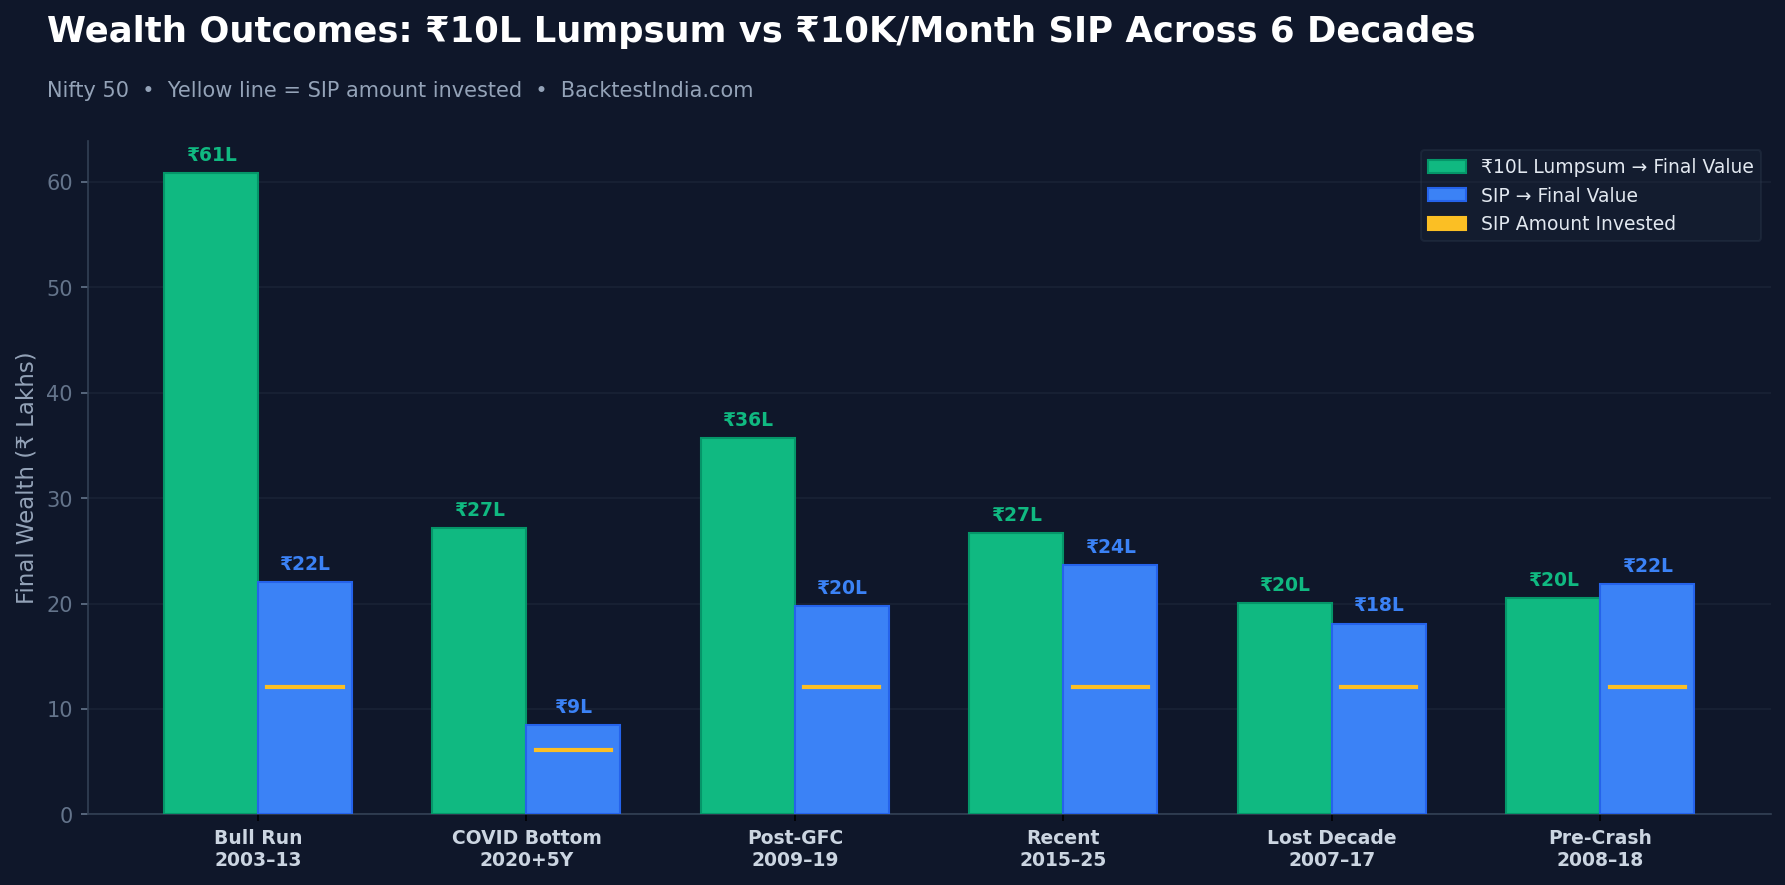
Wealth Outcomes
| Period | ₹10L Lumpsum → | SIP ₹10K/mo: Invested → Final |
|---|---|---|
| Bull Run (2003–2013) | ₹60.84L | ₹12.10L → ₹22.06L |
| COVID Bottom (2020+5Y) | ₹27.15L | ₹6.10L → ₹8.51L |
| Post-GFC (2009–2019) | ₹35.73L | ₹12.10L → ₹19.77L |
| Pre-Crash (2008–2018) | ₹20.50L | ₹12.10L → ₹21.84L |
| Recent (2015–2025) | ₹26.71L | ₹12.10L → ₹23.67L |
| Lost Decade (2007–2017) | ₹20.05L | ₹12.10L → ₹18.11L |
Note: Absolute wealth comparison is misleading because lumpsum deploys ₹10L upfront while SIP deploys ₹12.1L over time. XIRR vs CAGR comparison is the correct metric, shown in the previous table.
The Middle Path: Staggered Lumpsum
Direct Answer: Deploying a lumpsum in quarterly tranches over 12 months (staggered lumpsum) outperformed full lumpsum in crash-entry scenarios (9.78% vs 7.44%) but lagged in bull markets (16.01% vs 19.79%). It offers a behavioral compromise without the extreme outcomes of either pure approach.
| Scenario | Full Lumpsum CAGR | Staggered CAGR (4 × ₹2.5L quarterly) | SIP XIRR |
|---|---|---|---|
| Pre-Crash 2008 + 10Y | 7.44% → ₹20.50L | 9.78% → ₹25.42L | 11.53% |
| Bull Start 2003 + 10Y | 19.79% → ₹60.84L | 16.01% → ₹44.17L | 11.79% |
| COVID Crash 2020 + 5Y | 22.11% → ₹27.15L | 16.88% → ₹21.81L | 13.46% |
The staggered approach:
- ✅ Beat full lumpsum in the crash scenario (2008 entry)
- ⚠️ Lagged full lumpsum in bull markets (2003, 2020)
- Sits between full lumpsum and SIP in all scenarios — a genuine middle ground
💡 Practical Takeaway: If you have a lumpsum and want to reduce timing anxiety without the full delay of a 10-year SIP, deploying in 3–4 tranches over 6–12 months is a pragmatic compromise. You capture most of the benefit of early deployment while hedging against crash-at-entry risk.
Why Strategy Matters ~5× More Than Method
Direct Answer: Across all 167 ten-year rolling periods, the gap between a Low Volatility strategy and Nifty 50 averaged 2.26% per year. The gap between SIP and lumpsum on Nifty 50 averaged just 0.49% per year. Strategy selection had ~5× more impact than deployment method. Go further up the return stack — Quality Momentum delivered 17.95% CAGR vs Nifty's 10.42% — and that gap widens to over 7% per year, making method of deployment almost irrelevant.
This is the most important section of this entire article. The SIP vs Lumpsum debate absorbs enormous mental energy from Indian investors. But the data shows it's the wrong debate entirely. Our rolling returns study across 102 different 10-year entry points confirms this — Low Volatility produced higher returns than Nifty 50 in all 102 tested periods in that historical dataset, regardless of when an investor started. Past performance does not predict future results.
| Approach | Lost Decade (2007–2017) | 10Y Avg Across All Periods |
|---|---|---|
| Lumpsum in Nifty 50 | 7.20% CAGR | 11.98% |
| SIP in Nifty 50 | 7.95% XIRR | 11.49% |
| SIP vs Lumpsum gap: ~1% | Strategy gaps below: 2–4% | ||
| Low Volatility Strategy | 11.42% CAGR | 14.24% |
| Multi-Factor Strategy | — | 14.61% |
| Quality-Momentum Strategy | — | 17.95% |
Our rolling returns analysis shows the Low Volatility strategy beat Nifty 50 in 100% of 10-year periods—every single one of 102 periods tested. Meanwhile, the SIP vs lumpsum debate produces a coin flip.
The hierarchy of impact on your returns:
- Strategy selection (which factor/approach): 2–6% annual impact
- Time horizon (how long you hold): 2–4% annual impact
- Tax efficiency (LTCG vs STCG optimization): 0.44% annual impact
- Deployment method (SIP vs lumpsum): ~0.5% annual impact
Stop debating SIP vs lumpsum. Start researching factor investing.
Decision Framework
⚠️ CRITICAL - EDUCATIONAL ONLY
This framework is based on historical patterns. It is NOT personalized investment advice. Consult a SEBI-registered Investment Adviser before making any investment decisions.
When Historical Data Favored Lumpsum
- ✅ Markets recently crashed 30%+ (post-crash recovery periods)
- ✅ Valuations below long-term averages (Nifty PE < 18)
- ✅ You have a 15+ year horizon (100% lumpsum win rate at 15Y was 52.3%)
- ✅ You can tolerate significant short-term drawdowns without panic-selling
When Historical Data Favored SIP
- ✅ Markets near all-time highs with elevated valuations
- ✅ Volatile/range-bound market conditions
- ✅ You deploy regular salary income (no lumpsum available)
- ✅ Behavioral discipline is your primary concern
When Neither Method Is Sufficient
- ❌ Prolonged sideways markets (2010–2020 type): Both deliver sub-8% returns
- ❌ Plain Nifty 50 in bad decades: Consider factor strategies instead
The Practical Recommendation (Educational Only)
- Have a lumpsum + nervous? Stagger it over 3–6 months in quarterly tranches
- Have a lumpsum + confident? Deploy immediately — data shows 46–52% win rate
- Earning monthly salary? SIP is the only practical option — and it works well
- Regardless of method: Use a factor-based strategy rather than plain Nifty 50
Test Your Own SIP vs Lumpsum Scenarios
Pick any entry date from Dec 2006 onwards. Compare SIP, lumpsum, and factor strategies side by side.
- ✅ Custom date range backtesting
- ✅ Automatic LTCG/STCG tax calculations
- ✅ 5 factor strategies + Nifty 50 benchmark
- ✅ 1,700+ stocks including delisted companies
Educational Tool Only • Not Investment Advice • Consult SEBI-RIA Before Investing
📂 Download Full Audit Spreadsheet
Every number in this article is independently verifiable. We've published the complete audit workbook containing all 704 rolling windows, raw Nifty 50 monthly data, and full methodology documentation.
SIP vs Lumpsum Audit — Full Data (March 2002–Dec 2025)
287 monthly Nifty 50 closes · 704 rolling windows · XIRR & CAGR for every period · Methodology notes
Download .xlsx Audit FilePick any row. Pull Nifty closes from NSE. Recompute the XIRR yourself. Every number checks out.
What's Inside
- Sheet 1 — Audit Summary: Methodology parameters, headline win-rate table, verification instructions
- Sheet 2 — Raw Nifty Data: All 287 monthly closing prices (cross-check against any public source)
- Sheets 3–6 — Rolling Results: Every 5/7/10/15-year window with Start/End Nifty, SIP XIRR, Lumpsum CAGR, Winner, and difference
- Sheet 7 — Methodology: Full documentation of assumptions, formulas, and step-by-step verification guide
Frequently Asked Questions
⚠️ FAQ Disclaimer: Educational information only. Not personalized investment advice. Consult SEBI-registered Investment Adviser for your specific situation.
Q1: Is lumpsum better than SIP in India?
A: Neither is consistently better. Using proper XIRR-based measurement across 23 years of Nifty 50 data, SIP won 52% of 5-year periods while lumpsum won 46.3%. At 15-year horizons, lumpsum won 52.3% while SIP won 46.7%. Average returns are within 0.5% of each other. The winner depends on market regime — lumpsum wins from bottoms and during trends, SIP wins from peaks and during volatility.
Q2: Can SIP give negative returns?
A: Yes. The worst SIP XIRR in our 23-year dataset was -4.17% over 5 years (Mar 2015–Mar 2020). SIP is not immune to prolonged flat or declining markets, especially when the decline happens toward the end of the SIP tenure when you have the most accumulated units at risk.
Q3: Why do most articles say lumpsum always wins?
A: Because most analyses use a flawed calculation method — simple CAGR instead of XIRR for SIP returns. Simple CAGR treats all SIP installments as if invested at the same time, which understates SIP returns by 4–7 percentage points. When you use the correct XIRR method (which properly credits earlier installments that compound longer), the gap narrows dramatically and SIP actually wins slightly more often over 5 and 10-year horizons.
Q4: What is XIRR and why does it matter for SIP?
A: XIRR (Extended Internal Rate of Return) is the correct method for calculating returns on irregular cashflows like SIP. It accounts for the fact that your first SIP installment compounds for the entire period while your last installment barely compounds at all. AMFI, mutual fund platforms, and academic researchers all use XIRR for SIP return measurement. Simple CAGR severely understates SIP returns.
Q5: When does SIP beat lumpsum?
A: SIP beats lumpsum most decisively when: (1) markets crash early in the investment period (SIP buys cheap units), (2) markets are volatile/range-bound (SIP averages into dips), or (3) the big rally comes late (cheap accumulated units benefit). The best SIP edge was +9.88% XIRR over lumpsum CAGR (Dec 2007–Nov 2012). SIP also outperformed in 66 out of 227 five-year periods by margins of +2% or more.
Q6: When does lumpsum beat SIP?
A: Lumpsum beats SIP most decisively during: (1) strong upward trends from the entry point, (2) V-shaped crash recoveries where full exposure captures the entire rebound, or (3) sustained multi-year bull markets. The best lumpsum edge was +11.16% over SIP XIRR (Nov 2003–Nov 2008). Lumpsum outperformed by +5% or more in 35 out of 227 five-year periods.
Q7: What is staggered lumpsum and is it better?
A: Staggered lumpsum means deploying capital in 3–4 equal installments over 6–12 months instead of all at once. Our analysis shows it beat full lumpsum in crash-entry scenarios (9.78% vs 7.44% from Jan 2008) but lagged in bull markets (16.01% vs 19.79% from Apr 2003). It's a behavioral compromise that reduces timing anxiety without the full delay of multi-year SIP.
Q8: Does strategy matter more than SIP vs lumpsum?
A: Yes, substantially — about 5× more. Across all 167 ten-year rolling periods, the SIP-vs-lumpsum gap averaged 0.49% annually. The Low Volatility strategy-vs-Nifty gap averaged 2.26% annually — roughly 5× larger. BacktestIndia's rolling returns analysis shows Low Volatility beat Nifty in 100% of 10-year periods. Choosing the right factor strategy has far more impact than choosing between SIP and lumpsum.
Q9: How many rolling periods were tested?
A: 704 total rolling periods: 227 five-year, 203 seven-year, 167 ten-year, and 107 fifteen-year windows, covering every possible entry month from March 2002 to December 2025 on Nifty 50 monthly closing data. SIP returns are calculated using XIRR; lumpsum returns using CAGR. Zero XIRR calculation failures across all 704 periods.
Q10: I have ₹10 lakhs to invest — should I do SIP or lumpsum?
A: The data says it's roughly a coin flip on returns. The real question is behavioral: can you tolerate seeing ₹10L become ₹5L during a crash (lumpsum risk) or can you handle seeing markets rally 50% while your money slowly deploys (SIP opportunity cost)? If unsure, staggered lumpsum (deploy in 3–4 tranches over 6 months) is a practical compromise. But the most impactful decision is what you invest in — consider factor strategies over plain Nifty 50. Consult a SEBI-RIA for personalized advice.
Conclusion: Stop Debating Method, Start Choosing Strategy
After testing 704 rolling periods across 23 years of Nifty 50 data using proper XIRR methodology, the verdict is clear:
- It's a coin flip: SIP and lumpsum split wins roughly 50:50 across all horizons. Neither dominates consistently.
- Context determines the winner: Lumpsum wins from market bottoms; SIP wins from market peaks. Since you can't reliably predict which regime you're in, the choice matters less than you think.
- Both can fail: SIP delivered -4.17% XIRR in one 5-year window. Lumpsum delivered -0.86% in another. Neither is foolproof.
- Strategy matters ~5× more: The gap between Low Volatility and Nifty (2.26%/yr avg) is ~5× larger than the SIP-vs-lumpsum gap (0.49%/yr avg) across all 10-year rolling periods. Spend your energy on strategy selection, not deployment method.
- Staggered lumpsum is the practical middle: Deploy in 3–4 tranches over 6 months if you have a lumpsum and want peace of mind.
For strategies that have historically outperformed across all market regimes, explore our Factor Investing India Complete Guide — covering five strategies, 18 years of NSE data, and tax-aware analysis. Top performers: Quality Momentum (17.95% CAGR), Low Scaled Turnover Momentum (19.43% CAGR), and Low Volatility (12.38% CAGR, 100% rolling win rate).
Most Important: This is educational research analyzing historical data. It does NOT constitute personalized investment advice. Before implementing any investment strategy with real capital, you MUST consult a SEBI-registered Investment Adviser who can assess your specific financial situation, goals, risk tolerance, and time horizon. Find SEBI-RIA →
For more detailed factor analysis, explore our complete series:
- Factor Investing India: Complete Guide (Hub)
- Low Volatility India: 18-Year NSE Backtest
- Rolling Returns: Low Vol Won 100% of 10Y Periods
- Momentum Investing India Backtest
- Multi-Factor Investing India
- Quality-Momentum India (17.95% CAGR)
- Nifty 50 vs Next 50: 26-Year Results
- Free NSE Backtesting Tool
Strategy matters 13× more than SIP vs lumpsum.
You just saw that timing and method barely matter. What you invest in is everything.Our AI chatbot will help you discover which factor strategy — low volatility, momentum, or quality — suits your goals, then run a real 19-year NSE backtest with full tax calculations.
Find My Strategy — First Backtest Free →No finance knowledge needed · AI explains everything · Takes 2 minutes
⚠️ COMPREHENSIVE DISCLAIMER
EDUCATIONAL RESEARCH ONLY - NOT INVESTMENT ADVICE: This analysis presents historical data analysis of Nifty 50 returns for educational purposes only. We are NOT SEBI-registered Investment Advisers and do NOT provide personalized investment advice or recommendations.
METHODOLOGY NOTE: SIP returns calculated via XIRR (Extended Internal Rate of Return). Lumpsum returns calculated via CAGR. No transaction costs or taxes modeled. Past performance does not predict future results.
MANDATORY PROFESSIONAL CONSULTATION: Before implementing any investment strategy, you MUST consult a SEBI-registered Investment Adviser. Find registered advisers at: SEBI RIA Directory
REGULATORY STATUS: BacktestIndia.com is an educational statistical research tool. Content published under the proviso to Regulation 2(1)(l) and Regulation 4(a) of SEBI (Investment Advisers) Regulations 2013. Factor-level statistical analysis is not a "research report" per SEBI RA FAQ No. 4 (July 2025). Not SEBI-registered.
Research Author: T. Desai
Platform: BacktestIndia.com (Educational Research Platform)
Data Period: March 2002 – December 2025 (287 months, Nifty 50)
SIP Return Method: XIRR (Extended Internal Rate of Return)
Published: March 2026
Contact: backtestindia@gmail.com
Copyright: © 2026 T. Desai. All rights reserved.
📧 Questions or Feedback?
Contact us at backtestindia@gmail.com